In Episode 11 we learned about linker scripts and map files. That wraps up the “space (memory)” side of the story.
The theme of this final episode is “Optimization and Assembly.”
How does C code get converted into machine code? What can the compiler change, and what must it never change? Why is volatile necessary? — questions we first touched on in Episode 9. This time we settle them at the assembly level.
📖 Previous Article
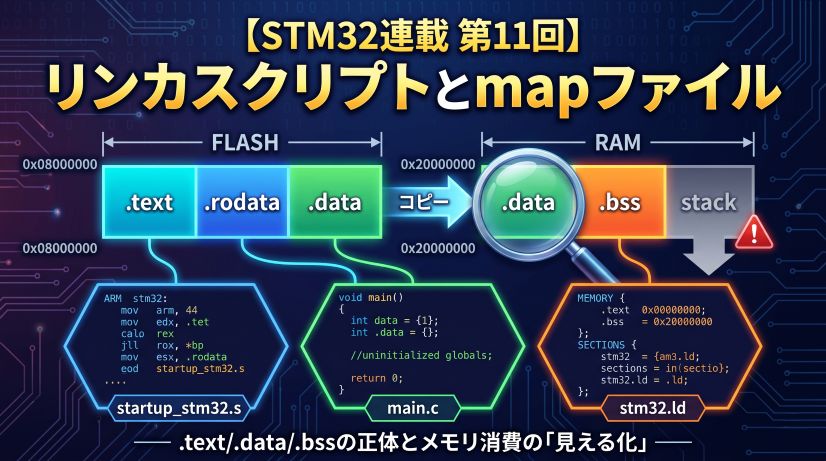
Episode 11: Linker Scripts and Map Files — Visualizing .text/.data/.bss and Memory Consumption
📍 Series Top Page
✅ What you'll be able to do after this article
- Explain the difference between
-O0/-O2/-Osand when to use each - Use
arm-none-eabi-objdumpto read assembly output and verify optimization effects - Understand the basics of reading the Thumb instruction set
- Explain at the assembly level why
volatileconflicts with optimization - Articulate all 12 episodes of learning as "the conditions for embedded mastery"
Table of Contents
- What Is Optimization?
- The Difference Between -O0 / -O2 / -Os
- Reading Assembly with objdump
- Four Things That Happen with -O2
- Revisiting volatile
- Optimization Traps and How to Avoid Them
- The Conditions for Embedded Mastery
- Summary
🔧 What Is Optimization?
The Compiler’s Job
The compiler is a tool that “converts C source code into machine code.” However, there is more than one way to do that conversion.
int add(int a, int b) {
    return a + b;
}
There are countless ways to convert this code into machine code while “preserving its meaning.” Compiler optimization means “transforming a program to be faster and/or smaller without changing its observable behavior.”
The C standard specifies that optimization may only change things that “cannot be observed.” Specifically:
- May change: register allocation, instruction reordering, removal of unnecessary variables, loop unrolling
- Must not change: the number and order of reads/writes to
volatilevariables; the final values of non-volatilevariables
Understanding this makes “why is volatile necessary?” naturally apparent.
The same C code produces completely different assembly depending on the optimization flag passed to the compiler.
⚙️ The Difference Between -O0 / -O2 / -Os
Here are GCC’s (arm-none-eabi-gcc) optimization options and their characteristics. In Episode 6 we experienced patterns where “-O0 works but -O2 breaks” in connection with pointer accidents and UB. This time we explain the mechanism at the assembly level.
| Option | Optimization Level | Characteristics | Primary Use |
|---|---|---|---|
-O0 |
None | C code and assembly are almost 1-to-1. Easy to debug | During development / debugging |
-O1 |
Light | Basic optimizations only. Middle ground between -O0 and -O2 | Rarely used |
-O2 |
Standard | Applies most optimizations. Appropriate for most production code | Production builds |
-O3 |
Aggressive | More aggressive (enhanced loop unrolling etc.). Code size increases | Computationally intensive processing |
-Os |
Size-priority | Prioritizes Flash savings. Smaller code fits better in cache lines, so can actually be faster than -O2 in some cases | When Flash space is tight |
-Og |
Debug-friendly optimization | Light optimization while maintaining debugger compatibility. Can actually be easier to step through than -O0 |
When you want some speed in debug builds |
-O0 is close to a 1-to-1 C-to-assembly mapping, but it also generates excessive stack operations and register saves — which can ironically make debugger step-through harder to follow. In recent GCC, -Og (debug-optimized) is increasingly recommended as the balance between “debuggability and speed.” It’s worth trying in CubeIDE debug builds.
CubeIDE’s defaults are -O0 for Debug builds and -Os (or -O2) for Release builds.
There’s no problem leaving -O0 during development, but don’t forget to build with -O2 or -Os and verify behavior before shipping to production. Enabling optimization will expose forgotten volatile declarations.
🔍 Reading Assembly with objdump
What Is objdump?
objdump is a command-line tool that reverse-disassembles compiled binary files (ELF format, etc.) into assembly representation. It’s provided as part of the GNU Binary Utilities (binutils) and is used to verify how the compiler converted C code into machine code.
C source code  ─[compiler]→  machine code (binary)
machine code (binary)  ─[objdump]→  assembly display (human-readable)
[MyProject.elf] ──(arm-none-eabi-objdump -d -S)──→ [output.asm]
When you want to confirm “which register is this variable in?” or “was this instruction eliminated by optimization?” in the debugger, objdump is a powerful clue.
objdump comes in versions that support each target architecture, and can be used across a wide range of environments beyond STM32.
| Environment | Command | Instruction Set |
|---|---|---|
| STM32 (Cortex-M) | arm-none-eabi-objdump |
Thumb-2 |
| Arduino UNO / Mega (AVR) | avr-objdump |
AVR |
| ESP32 (Xtensa) | xtensa-esp32-elf-objdump |
Xtensa LX6 |
| Raspberry Pi / Linux ARM | aarch64-linux-gnu-objdump or objdump (native) |
AArch64 |
| x86 PC (Linux) | objdump (pre-installed) |
x86-64 |
Only the command name differs — usage (options) is almost the same across all environments. With Arduino IDE, you can pass the .elf file generated during a build to avr-objdump -d and get the same result.
Where to Run It: cmd (Command Prompt), Not CubeIDE
objdump is not called from CubeIDE’s menu — it is a command-line tool that you run from Windows Command Prompt (cmd) or PowerShell.
When you install CubeIDE, arm-none-eabi-objdump is bundled inside it. You call it directly from cmd.
Step 1: Find arm-none-eabi-objdump
Open PowerShell and use the following command to search automatically.
Get-ChildItem "C:\ST" -Recurse -Filter "arm-none-eabi-objdump.exe" -ErrorAction SilentlyContinue | Select-Object -ExpandProperty FullName
Example output:
C:\ST\STM32CubeIDE_1.15.1\STM32CubeIDE\plugins\com.st.stm32cube.ide.mcu.externaltools.gnu-tools-for-stm32.12.3.rel1.win32_1.0.100.202403111256\tools\bin\arm-none-eabi-objdump.exe
The version number in the folder name will vary, but the structure is the same.
Step 2: Add to PowerShell PATH
Add the tools\bin folder from the found path to the current session’s PATH.
# Automatically get the path and add to PATH (copy-paste ready)
$env:PATH += ";$(Split-Path (Get-ChildItem 'C:\ST' -Recurse -Filter 'arm-none-eabi-objdump.exe' -ErrorAction SilentlyContinue | Select-Object -ExpandProperty FullName -First 1))"
Verify it works:
arm-none-eabi-objdump --version
[System.Environment]::SetEnvironmentVariable(
  "PATH",
  $env:PATH + ";C:\ST\STM32CubeIDE_1.15.1\STM32CubeIDE\plugins\com.st.stm32cube.ide.mcu.externaltools.gnu-tools-for-stm32.12.3.rel1.win32_1.0.100.202403111256\tools\bin",
  "User"
)
After running, close and reopen PowerShell — it will work in future sessions. Replace the version number part with the actual path found by Get-ChildItem.
Step 3: Navigate to the Debug Folder Containing the ELF File and Run
When you build in CubeIDE, a .elf file is generated inside the project folder.
ProjectName\
  Debug\               ← Output for Debug builds
    ProjectName.elf   ← Use this
  Release\
    ProjectName.elf
Navigate to the Debug folder in PowerShell and run:
cd D:\path\to\ProjectName\Debug

arm-none-eabi-objdump -d -S ProjectName.elf > output.asm
To open in VSCode:
code output.asm
When a Warning Appears
You may see a warning like this when running:
Warning: source file main.c is more recent than object file
This is not an error — output.asm is generated correctly.
It means “the source file was edited after the build, so the C source line numbers shown may be slightly off from the assembly.” If you want to eliminate the warning for clean output, do a rebuild in CubeIDE (Ctrl+B) and then run objdump again.
Main Options
| Option | Meaning | When to use |
|---|---|---|
-d |
Disassemble executable sections | Basic. This alone outputs all functions |
-S |
Show C source and assembly interleaved | Especially useful with -O0 builds |
-h |
Show section list (.text/.data/.bss sizes) | Alternative to arm-none-eabi-size |
--no-show-raw-insn |
Hide raw instruction bytes for readability | When you only want to read assembly |
Common Command Patterns
:: ① Disassemble everything and save to file
arm-none-eabi-objdump -d ProjectName.elf > output.asm

:: ② Interleaved C source display (recommended with -O0 build)
arm-none-eabi-objdump -d -S ProjectName.elf > output_with_src.asm

:: ③ Check section sizes (Flash/RAM usage estimate)
arm-none-eabi-objdump -h ProjectName.elf

:: ④ Extract a specific function (Windows: use findstr)
arm-none-eabi-objdump -d ProjectName.elf | findstr /C:"<compute>" /C:"add" /C:"mov" /C:"bx"
Using -S (interleaved C source display) requires “generate debug information” to be enabled in CubeIDE’s build settings (Debug builds have this on by default). In Release builds, the -g flag is often removed, so -S may not show C source.
Sample Output
What output from -d -S looks like (with an -O0 build):
08000234 <compute>:
compute():
/workspace/Core/Src/main.c:45
    int result = a + b;
 8000234:  push    {r7}
 8000236:  sub     sp, #12
 8000238:  add     r7, sp, #0
/workspace/Core/Src/main.c:46
    return result;
 800023a:  ldr     r3, [r7, #4]   ; load a
 800023c:  ldr     r2, [r7, #8]   ; load b
 800023e:  add     r3, r3, r2     ; a + b
 8000240:  mov     r0, r3         ; set return value
 8000242:  add     sp, #12
 8000244:  pop     {r7}
 8000246:  bx      lr             ; return
The 8000234 at the far left is the address in Flash (the “addresses are reality” concept from Episode 1 appears here). With -O2, you can compare how far this code gets compressed.
What to look for when reading output.asm:
| Point of focus | Instruction to find | What it means |
|---|---|---|
| Function entry | push {r4, lr} |
Registers saved to stack — more saves means more callers |
| Variable operations | ldr / str |
RAM read/write. If expected ones are missing, suspect volatile |
| Function exit | bx lr or pop {pc} |
Return. -O2 often converts to pop {pc} |
| Optimized-away code | Expected instruction absent | Evidence of dead code elimination or constant folding |
The Thumb and Thumb-2 Instruction Sets
Before reading objdump output, let’s get the background of the instruction set used by STM32.
📌 What Is an Instruction Set (ISA)?
A “list of instruction types and formats that a CPU can execute.”
Different architectures have different instruction sets, and binary machine code is not compatible between them.
🔁 The Flow from ARM → Thumb → Thumb-2
⚖️ Comparison of Three Instruction Sets
| ARM | Thumb | Thumb-2 | |
|---|---|---|---|
| Instruction width | 32-bit fixed | 16-bit fixed | 16/32-bit mixed |
| Code size | Large | Small (▲30%) | Small (▲25%) |
| Expressiveness | High | Limited | High |
| Primary CPUs | Cortex-A | Legacy | Cortex-M3/M4/M7 |
| STM32F401 | ❌ Not available | ❌ Not available | ✅ This only |
The compiler automatically selects between 16-bit and 32-bit versions for each instruction.
- Simple arithmetic → 16-bit instruction (Flash savings)
- Large immediate values / complex operations → 32-bit instruction (expressiveness)
You don’t need to think about it. The compiler picks the optimal width.
Why are 32-bit instructions necessary? Because some things simply don’t fit in a 16-bit format. For example, handling a 32-bit immediate value with movw/movt requires a 32-bit instruction. Conditional execution for expressions like if (x != 0) is similar. Far branches also require 32-bit instructions — when the jump target is beyond the reach of a 16-bit instruction, which becomes important in large programs. The mixed-width approach was adopted to achieve both “compactness” and “expressiveness.”
Here is how the compiler decides which width to use for each instruction:
What this looks like in Flash: 16-bit (2-byte) and 32-bit (4-byte) instructions are packed together like Tetris pieces — no gaps, no padding.
Addresses in Flash
┌────────────┬────────────┬────────────────────────┬────────────┐
│ 0x08000000 │ 0x08000002 │     0x08000004         │ 0x08000008 │
├────────────┼────────────┼────────────────────────┼────────────┤
│  add (16)  │  sub (16)  │   movw / bl  (32-bit)  │  bx  (16)  │
│  2 bytes   │  2 bytes   │        4 bytes          │  2 bytes   │
└────────────┴────────────┴────────────────────────┴────────────┘
The Cortex-A series can switch between ARM instruction mode and Thumb mode, but Cortex-M (STM32) is Thumb-2 only — ARM mode doesn’t exist at all.
→ Every instruction in objdump output is Thumb-2.
Supplement: Thumb mode and odd addresses (the T-bit)
In the ARM architecture, when a function pointer address is odd (LSB = 1), it indicates that function executes in Thumb mode. This lowest bit is called the T-bit (Thumb bit) — it’s the flag the CPU uses to determine “should I interpret the next instruction in Thumb mode or ARM mode?” The “addresses are reality” concept from Episode 1 appears here too. The actual Flash address is even, but the address stored in the vector table is recorded as +1 (odd). CubeIDE and HAL handle this automatically so you don’t need to think about it, but if you look at the vector table with objdump you can see the odd addresses lined up.
Reading Thumb Instructions: The Basics
The instructions that commonly appear in objdump output. They’re easier to read when learned in groups.
Memory Access
| Instruction | Meaning |
|---|---|
ldr r0, [r1] |
Load from address in r1 into r0 (RAM → register) |
str r0, [r1] |
Store value of r0 to address in r1 (register → RAM) |
ldrb r0, [r1] |
Load 1 byte only (ldr loads 4 bytes) |
strb r0, [r1] |
Store 1 byte only |
Arithmetic
| Instruction | Meaning |
|---|---|
add r0, r1, r2 |
r0 = r1 + r2 |
sub r0, r1, #4 |
r0 = r1 − 4 |
mov r0, #42 |
r0 = 42 (immediate assignment) |
mul r0, r1, r2 |
r0 = r1 × r2 |
Branches and Function Calls
| Instruction | Meaning |
|---|---|
bl func |
Call func (saves return address to lr) |
bx lr |
Jump to address in lr (function return) |
b label |
Unconditional jump to label |
beq label |
Jump to label if previous comparison was Equal |
Stack Operations
| Instruction | Meaning |
|---|---|
push {r4, lr} |
Push r4 and lr onto the stack (common at function start) |
pop {r4, pc} |
Restore r4 and pc (popping to pc simultaneously returns) |
🔬 Four Things That Happen with -O2: Representative Optimizations
Let’s see the effects of optimization with real code examples.
1. Constant Folding
int result = 2 * 1000 * 1000; /* 2,000,000 */
/* -O0: two multiply instructions */
mov  r0, #2
mov  r1, #1000
mul  r0, r0, r1    /* r0 = 2000 */
mul  r0, r0, r1    /* r0 = 2000000 */

/* -O2: computed at compile time → single immediate */
movw r0, #0x4240
movt r0, #0x1e     /* r0 = 2000000 (immediate) */
An immediate value is a number embedded directly in the instruction itself. There’s no need to fetch it from RAM — it arrives at the CPU simultaneously with the instruction fetch, making it zero-cost. Anything computable at compile time becomes zero-cost at runtime.
2. Dead Code Elimination
int compute(int x) {
    int unused = x * 100;   /* never-used variable */
    return x + 1;
}
/* -O0: the unused computation is present */
mul  r1, r0, #100
str  r1, [sp]        /* saved to stack */
add  r0, r0, #1

/* -O2: unused disappears completely */
add  r0, r0, #1
bx   lr
3. Inlining
static inline int square(int x) { return x * x; }

int main_calc(int a) {
    return square(a) + square(a + 1);
}
/* -O0: two bl (function call) instructions to square */
bl   square
bl   square

/* -O2: square body expanded into main_calc (no bl) */
mul  r1, r0, r0          /* a * a */
add  r2, r0, #1
mul  r2, r2, r2          /* (a+1) * (a+1) */
add  r0, r1, r2
bx   lr
This is also advantageous from a register allocation — the compiler’s task of deciding which variables to place on the CPU’s extremely scarce “ultra-fast work desks” (registers) and reuse them — perspective. When a function call crosses a boundary, registers must be saved per the calling convention. After inlining, all computation is within a single function, allowing the compiler to allocate registers more freely.
However, there is a side effect. Inlining the same function in many places bloats code size. Larger code degrades the instruction cache (I-Cache) hit rate, and in some cases can actually be slower than -O0. The compiler uses a cost model to automatically decide “inline or not,” but the bottom line is always verify by measuring.
The inline keyword is a suggestion (hint) to the compiler — the final decision on whether to inline belongs to the compiler. At -O2 or higher, a function may be inlined even without inline, and conversely, a function marked inline may not be inlined.
Also, static inline and inline have different meanings. Without static, the function has external linkage, and to allow references from other translation units, a concrete copy may be emitted anyway. For inline functions written in headers, static inline is the safe choice.
4. Loop Unrolling
uint32_t sum = 0;
for (int i = 0; i < 4; i++) {
    sum += arr[i];
}
/* -O2: loop unrolled into 4 instructions */
ldr  r1, [r0]
ldr  r2, [r0, #4]
add  r1, r1, r2
ldr  r2, [r0, #8]
add  r1, r1, r2
ldr  r2, [r0, #12]
add  r0, r1, r2
The loop counter comparison and branch disappear.
The reason this is effective is pipeline stalls. The CPU prefetches and executes instructions in parallel, but when a conditional branch (beq/blt etc.) appears, the prediction of “which instruction to execute next” can be wrong, and the mispredict cost stalls the pipeline. Eliminating branches removes this loss.
The tradeoff is that the unrolled instructions consume more Flash. This is effective when iteration count is small and fixed; applying it to large loops can cause Flash shortage.
Summary of Four Optimizations: Benefits and Risks
| Optimization | Benefit | Risk / Notes |
|---|---|---|
| Constant folding | Zero runtime computation cost | Essentially none (safe) |
| Dead code elimination | Saves Flash and execution time | Variables can “disappear” in the debugger (verify with -O0) |
| Inlining | Zero function call overhead | Code size bloat → I-Cache hit rate drops, can actually be slower |
| Loop unrolling | Eliminates pipeline stalls | Increases Flash consumption |
Every optimization only “has the potential to be faster” — whether it’s actually faster must be verified by measuring.
⚡ Revisiting volatile
Why Is volatile Necessary? (Seen in Assembly)
In Episode 9 we learned “volatile missing causes a hang with -O2.” This time we verify why at the assembly level.
/* ISR-shared flag (no volatile) */
uint8_t g_flag = 0;

void wait_for_flag(void) {
    while (g_flag == 0) {
        /* wait */
    }
}
/* -O0: reads g_flag from RAM every iteration */
.loop:
  ldrb r0, [r1]      /* load g_flag from RAM */
  cmp  r0, #0
  beq  .loop         /* if 0, loop */
  bx   lr

/* -O2: reads g_flag once, keeps it in register */
  ldrb r0, [r1]      /* load g_flag from RAM (only once!) */
  cbz  r0, .inf_loop /* if 0, jump to infinite loop */
  bx   lr
.inf_loop:
  b    .inf_loop     /* loops forever without re-reading RAM */
The compiler determines “there is no code that modifies g_flag inside this function” and omits re-reading RAM. Even if an ISR overwrites it, the CPU only sees the register copy and never notices.
/* ✅ Add volatile */
volatile uint8_t g_flag = 0;
/* -O2 (with volatile): reads from RAM every iteration */
.loop:
  ldrb r0, [r1]      /* reads from RAM every time (not optimized away) */
  cmp  r0, #0
  beq  .loop
  bx   lr
volatile is the keyword that tells the compiler “this memory location may be modified by something other than the CPU (ISR, DMA, hardware).”
What’s happening with -O2 (no volatile):
and never notices the RAM change
volatile does not mean “disable optimization.” It means “do not omit or reorder any access to this address.”
- Guarantees the number of accesses (no omission)
- Guarantees the order of accesses (no reordering)
Register arithmetic itself can still be optimized. It only guarantees the count and order of RAM “reads and writes.”
In Episode 10 we learned about the cache coherency problem with DMA buffers. That problem and the volatile problem here share the same essential structure: “the value the CPU sees diverges from the actual value.”
- Missing volatile → compiler skips re-reading RAM → CPU only sees the register copy
- Cache coherency → DMA updates RAM but CPU only sees the cache copy
The solution direction is also the same: “make the CPU always look at the real thing (RAM).” volatile is an instruction to the compiler; __DMB() is an instruction to the hardware — that’s the only difference.
What volatile prevents is compiler-level reordering and caching. It cannot prevent the CPU from reordering instructions at the hardware level (“out-of-order execution”). Preventing that requires memory barrier instructions like __DMB() (Data Memory Barrier).
However, the STM32F401 (Cortex-M4) does not have out-of-order execution. Instructions always execute in program order. So on Cortex-M4, volatile alone is practically sufficient — but when porting to Cortex-A (Linux embedded, etc.), this distinction becomes critical.
⚠️ Optimization Traps and How to Avoid Them
Trap 1: Missing volatile on ISR-Shared Variables
This is exactly Episode 9 Anti-Pattern 2. Works with -O0, suddenly hangs with -O2.
Mitigation: Add volatile to every variable shared with an ISR.
Trap 2: Non-Atomic Updates Even With volatile
volatile uint32_t g_count;  /* volatile doesn't make it atomic */

/* ISR */
void TIM2_IRQHandler(void) {
    g_count++;   /* 3 instructions: LDR + ADD + STR → can conflict with main */
}
As detailed in Episode 9 Anti-Pattern 4, volatile only prevents omission of accesses — it does not guarantee atomicity of multiple instructions. Simple reads and writes to a 4-byte-aligned single integer of 32 bits or less are architecturally atomic, but increment (read-modify-write) is not (non-aligned cases such as __packed structs require separate verification).
Mitigation: Protect critical counter updates in a critical section, or surround with __disable_irq().
Trap 3: Situations Requiring Memory Barriers
The compiler may reorder writes to DMA buffers.
g_tx_buf[0] = 'H';
g_tx_buf[1] = 'i';
__DMB();   /* Data Memory Barrier: ensure writes complete before starting DMA */
HAL_UART_Transmit_DMA(&huart2, g_tx_buf, 2);
On STM32F401 (Cortex-M3/M4) out-of-order execution doesn’t exist so this rarely causes problems in practice, but get in the habit of adding barriers to portable code for safety.
Trap 4: Disabling Optimization at the Function Level
There is a way to leave just the functions you don’t want optimized at -O0, such as hardware initialization:
/* Disable optimization for this function only */
__attribute__((optimize("O0")))
void hw_init_sensitive(void) {
    /* Delicate initialization sequence */
    GPIOA->BSRR = GPIO_BSRR_BS5;
    for (volatile int i = 0; i < 100; i++);   /* intentional wait */
    GPIOA->BSRR = GPIO_BSRR_BR5;
}
🏆 The Conditions for Embedded Mastery
Let’s organize what we’ve learned in this series as “the thinking circuits of a strong embedded engineer.”
12 Episodes of Buildup
| Episode | Theme | Weapon Gained |
|---|---|---|
| #0 | The embedded worldview | The three axes: “space, time, electricity” |
| #1 | The address world | Addresses are reality |
| #2 | Flash / RAM / Stack | Being conscious of a variable’s “address” |
| #3 | Structs and padding | Reading the “shape” of memory |
| #4 | Register operations | The satisfaction of hitting BSRR directly |
| #5 | Pointer = typed address | Pointers aren’t scary — they’re weapons |
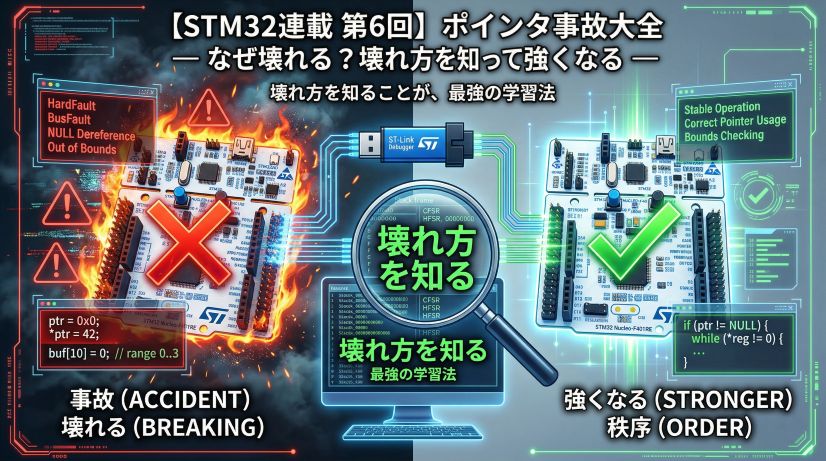
| #6 | Pointer accidents | Knowing how things break makes you stronger |
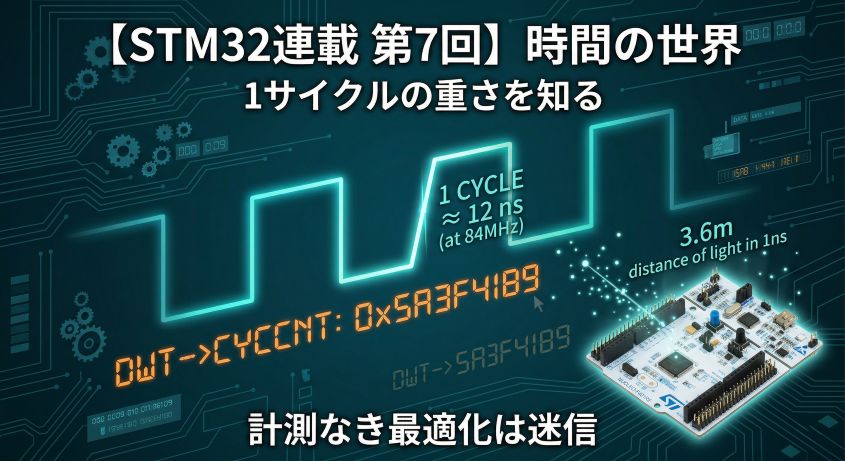
| #7 | The world of time | Optimization without measurement is superstition |
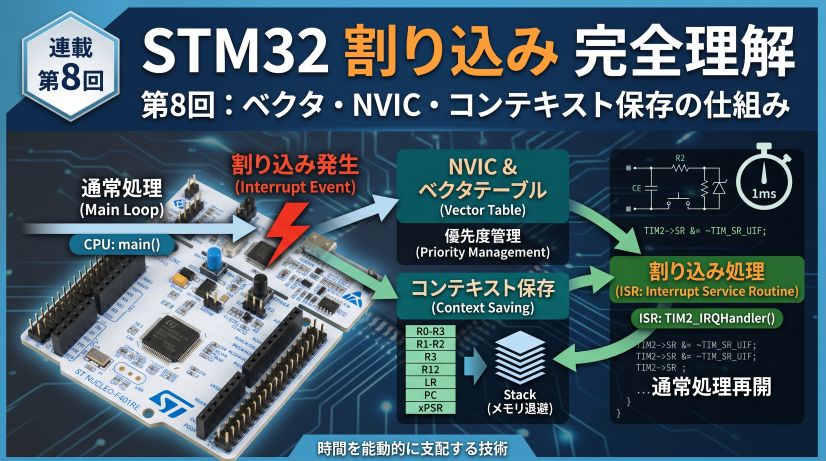
| #8 | How interrupts work | Reading the NVIC and vector table |
| #9 | Interrupt anti-patterns | Knowing every “break pattern” |
| #10 | DMA | Choosing the CPU’s work |
| #11 | Linker scripts / map | “Visualizing” the full memory picture |
| #12 | Optimization / Assembly | Verifying the compiler’s transformation yourself |
Five Habits of a Strong Embedded Engineer
Be conscious of “which address is this data at?” rather than variable names. Is it on the stack, in global space, in a peripheral register? That alone tells you “can I pass this to DMA?” and “is it safe to access from an ISR?”
“Probably slow” and “probably fast” are banned. Measure with DWT CYCCNT before saying anything. Optimization without profiling deletes the wrong thing and leaves the right thing untouched.
Get in the habit of looking at assembly with objdump -d. Knowing “how does the compiler see this code?” lets you spot volatile, atomic, and optimization issues before they happen.
NULL dereference, stack overflow, missing volatile, DMA buffer errors — keeping these “break patterns” in your head lets you see a bug and immediately think “that trap.”
ISRs are not ordinary functions. The boundary between the “world being interrupted” and the “world that interrupts” is an implicit context switch — always be conscious of it when writing code.
The Essence of Mastery: “Seeing What’s Invisible”
The strength of an embedded engineer is “seeing things that ordinary programmers can’t see.”
- Invisible to Arduino users → register values
- Invisible without a debugger → stack state
- Invisible if you only run at -O0 → optimization effects
- Unknown without reading a map file → which module is eating RAM
- Unknown without objdump → what the compiler did
This series has cultivated that “ability to see.”
“Addresses are the only reality”
Variable names, function names, types — these are all abstractions for the programmer’s convenience. The CPU’s reality is only “addresses and the bit patterns at them.”
When this truth sinks in, embedded’s “scary” transforms into “interesting.”
Stack, registers, interrupts, DMA, linker scripts, optimization — all of it is the art of correctly handling addresses and bits.
Summary
What we learned this episode:
| Concept | Content |
|---|---|
| The optimization principle | “Make it faster and smaller without changing observable behavior” |
| -O0 vs -O2 | -O0 is 1-to-1 for debugging; -O2 is for production |
| Constant folding | Anything computable at compile time is zero-cost at runtime |
| Inlining | Eliminates the call overhead of small functions |
| Dead code elimination | Unused variables and code disappear completely |
| The meaning of volatile | Guarantees the count and order of RAM accesses (no omission) |
| objdump | Can verify the compiler’s transformation via assembly output |
Thank you for joining us from Episode 0 through Episode 12 in “The Embedded World Beyond Pointers.”
There were three things this series wanted to convey:
- The ability to see addresses — the true nature of memory, registers, and the stack
- The habit of being conscious of time — measurement, interrupts, and the rhythm of DMA
- Strength through knowing how things break — pointer accidents, anti-patterns, and optimization traps
Going forward, keep being an embedded engineer who asks “why does it work?” rather than “it works, so fine.”
A pointer is the only bridge that connects physical wiring to logical variables. If this series gave you even a little of the power to verify that bridge with your own eyes, nothing would make me happier.
When you write C code now and an “address” comes to mind — that is the proof you read this series.
Afterword: Generative AI and Embedded Development
Let me close with something I was thinking about throughout writing this series.
Generative AI is a remarkably useful tool — I use it extensively myself. Scaffolding code, narrowing down error causes, quickly reading English in a datasheet — the speed gains in these areas are real.
But I also feel that just using what’s generated without thinking leads to a ceiling, the harder you push. Especially in the embedded world.
Why?
Generative AI outputs code that “looks right.” But whether “code that looks right” will actually work on real hardware is something where there are always situations you can only confirm by connecting a debugger, watching a waveform, and verifying it yourself.
- The oscilloscope waveform is “somehow wrong”
- The variable in the debugger is showing a value that’s “logically impossible”
- Worked until you switched to -O2, now it doesn’t
Especially in embedded environments, software directly touches hardware. Sensor response timing, power-on sequences, communication bus noise — embedded engineers regularly encounter these “problems that only reproduce in front of the actual hardware.” Even if AI writes you perfect-looking code, the moment it’s loaded onto a real board and doesn’t work, diagnosing the cause always comes down to chasing it step by step yourself, while watching the debugger and oscilloscope.
At moments like that, even if you ask an AI, “a plausible-sounding answer” comes back. But if you don’t have register knowledge yourself, you can’t judge whether that answer is correct.
To truly weaponize generative AI, you need the fundamental ability to verify its output. And that ability comes from the experience of once having chased “why does it break?” yourself.
If this series was even a small help in building that “power to verify,” there’s nothing that could make me happier.
Sitting in front of a debugger and oscilloscope, confirming with your own eyes. That habit alone is the core of what it means to be an embedded engineer — and I believe that won’t change no matter what AI appears next.
🚀 The View Beyond: Further Heights Ahead
This series closes here for now, but with the foundational strength you’ve built, you should be ready to take on steeper mountains. Here are topics I’d like to cover in a future “advanced” edition:
RTOS (Real-Time OS)
This is where the knowledge of “interrupts” and “stack” you learned in this series really catches fire. Using FreeRTOS as a subject: how do multiple tasks run “simultaneously”? How do you safely communicate between tasks using semaphores and queues? We’ll graduate from bare-metal (no OS) and cultivate the ability to “architect” complex systems.
Low-Power Design
“Making it run” is easy — “making it sleep intelligently” is an art. Sleep, Stop, and Standby modes; wake-up timing; peripheral behavior under low power — we’ll dive deep into the techniques essential for battery-powered devices.
Firmware Updates and Bootloaders
One challenge every product developer faces is “how do you safely rewrite the program in the field?” From Flash sector management to a custom bootloader update mechanism, we’ll cover immediately applicable knowledge for real product work.
DSP (Digital Signal Processing) and Math
We’ll make full use of the Cortex-M4’s FPU (Floating-Point Unit) and DSP instructions. Filtering sensor data, FFT (Fast Fourier Transform) — we’ll translate math into code and learn techniques for analyzing the physical world in real time.
Modern Development Process (Unit Tests / CI)
Breaking free from “can only test with real hardware.” We’ll explore abstracting hardware to run unit tests on a PC, and how to bring CI (Continuous Integration) with GitHub Actions into the embedded world.
There is no end to the embedded engineer’s journey.
But with the foundation of pointers and addresses — “the lowest, yet most important base” — firmly in place, you should be able to interpret any new technology on your own terms.
See you at the next “world beyond pointers!”
FAQ
Q. Code that doesn’t work at -O2 works at -O0. What should I suspect?
First suspect a missing volatile. Check whether all variables shared with ISRs or DMA, and pointers to hardware registers, have volatile. Next check the lifetime of local variables (access after stack is freed).
Q. When do you use __attribute__((optimize("O0")))?
Use it when you need “strict instruction ordering” in hardware initialization sequences, or intentional wait loops where you manually adjust timing. But heavy use increases Flash size.
Q. How are Thumb and ARM instructions distinguished and used?
Cortex-M (M0–M7) is Thumb-2 instruction set only — you cannot switch to ARM mode (32-bit-width instructions). Thumb-2 mixes 16-bit and 32-bit instructions, and its balance of code size and performance is a key characteristic. Everything shown in objdump output is Thumb instructions.
Q. Which should I use for production, -Os or -O2?
If you have Flash headroom, use -O2; if Flash space is tight, use -Os. For processing where speed matters most (FFT, control algorithms), -O2 or -O3; for projects where you want to reduce overall code size, -Os is the typical choice.
Q. What should I read next after this series?
- Real-Time OS: FreeRTOS basics (tasks, queues, semaphores)
- Deeper peripherals: Using STM32’s SPI/I2C/ADC with DMA
- Safety design: MISRA-C, functional safety, watchdog timers
- Networking: LwIP, MQTT, TLS on STM32

![[STM32 Series #9] Interrupt Design Anti-Patterns — Learn ISR Pitfalls by Deliberately Breaking Things](/posts/stm32-episode09/thumbnail.jpg)