In Episode 6 we experienced six types of pointer accidents. The first six episodes were all about “the world of space” — addresses, memory, registers, where the CPU places data.
Starting now, we enter Phase 2: the world of time.
“How long does this code take?”
This is a question an embedded engineer must be able to answer immediately. Yet many beginners get by with “seems fast” or “probably fine.”
Optimization without measurement is superstition. In this episode we’ll feel the “weight of one clock cycle” firsthand and acquire the tools to measure execution time in µs.
The core of this article is two things: “how to use DWT CYCCNT” and “the habit of measuring.” You can skip the clock tree details and come back to them later.
📖 Previous Article
#6: The Complete Pointer Accident Handbook — How and Why Things Break
📍 Series Index
✅ What You'll Be Able to Do After This Article
- Calculate clock frequency and "time per cycle"
- Explain the difference between HAL_GetTick() and DWT CYCCNT and when to use each
- Enable DWT CYCCNT and measure execution time in µs
- Measure execution time with GPIO toggle + oscilloscope (or logic analyzer)
- Adopt the embedded engineer's thinking habit: "measure before discussing"
Table of Contents
- Why “Time” Is the Essence of Embedded
- What Is a Clock?
- Time-Measurement Tools for Embedded
- DWT CYCCNT — A Cycle-Precision Measurement Instrument
- Measuring in Practice (Experiments 1–3)
- Measuring with GPIO Toggle + Oscilloscope
- DWT CYCCNT Caveats
- Practical Scenarios
⏱️ Why “Time” Is the Essence of Embedded
For PC programs, “faster is always better.” Embedded systems demand “functioning at exactly the right time, reliably.”
- Motor control: PWM duty must be updated every 1ms or the output jitters
- Communication protocols (UART/SPI): a single bit of timing error causes data corruption
- Sensor reading: inaccurate sampling intervals degrade measurement precision
- Safety systems: if the system doesn’t respond within the specified time, the watchdog resets it
“Seems fast” doesn’t cut it. Knowing execution time as a number is the fundamental fitness of an embedded engineer.
🕐 What Is a Clock?
How the CPU “Marks Time”
Inside a microcontroller flows a periodic electrical signal generated by a crystal oscillator or PLL (Phase Locked Loop). This is the clock.
The CPU operates synchronously with this clock. The clock signal alternates between “High (high voltage)” and “Low (low voltage),” and the CPU advances one operation with each rising edge (Low→High transition).
⚠️ 画像が見つかりません: /posts/stm32-episode07/clocksig.png
One cycle is the time from “going High” to “going High again.” At 84MHz, this repeats 84 million times per second.
NUCLEO-F401RE Clock
The STM32F401RE’s maximum clock frequency is 84MHz.
| Clock setting | Frequency | Time per cycle |
|---|---|---|
| Maximum (default) | 84 MHz | ≈ 11.9 ns |
| Medium | 42 MHz | ≈ 23.8 ns |
| Low power | 16 MHz (internal RC) | ≈ 62.5 ns |
1Hz = 1 cycle per second. 1MHz = 1 million cycles per second. 84MHz = 84 million cycles per second.
The time per cycle is the reciprocal of frequency:
T = \frac{1}{f} = \frac{1}{84 \times 10^6 \text{ Hz}} \approx 11.9 \text{ ns}For ESP32 (240MHz) it’s about 4.2ns; for AVR (16MHz) about 62.5ns — calculated with the same formula.
The Clock Tree — Where Does 84MHz Come From?
“84MHz” isn’t magic. It’s generated inside the microcontroller by a chain of multiplication and division called the clock tree.
On the NUCLEO-F401RE, the CubeMX default configuration uses HSI (internal RC oscillator, 16MHz) as the source:
Internal RC oscillator (HSI): 16 MHz
        ↓  PLLM=16 (divide) → 1 MHz
        ↓  PLLN=336 (multiply) → 336 MHz
        ↓  PLLP=4 (divide)
  SYSCLK: 84 MHz  ← clock used by the CPU
        ↓
   HCLK: 84 MHz  ← AHB bus (RAM, DMA)
     ↓              ↓
APB1: 42 MHz    APB2: 84 MHz
(TIM2-7, etc.) (TIM1,8, SPI1, USART1, etc.)
A circuit that multiplies a low-frequency source clock to an integer multiple. The formula is input ÷ PLLM × PLLN ÷ PLLP. For this board: 16MHz ÷ 16 × 336 ÷ 4 = 84MHz. The “Clock Configuration” tab in STM32CubeIDE shows this path graphically.
STM32 has two clock sources: internal RC (HSI) and external crystal (HSE). HSI requires no external components and is convenient, but has ±1% variation due to temperature and unit-to-unit differences. HSE achieves crystal precision (±20ppm or better), needed when exact frequencies are required for UART or USB. Both can generate 84MHz SYSCLK, so it doesn’t matter which one is used for today’s measurement experiments.
You can check the actual running frequency in the IDE or in code. In STM32CubeIDE, the Clock Configuration view shows it visually.
⚠️ 画像が見つかりません: /posts/stm32-episode07/cubemx_clock_config.png
In CMSIS-compliant environments, the SystemCoreClock variable holds the actual clock frequency (Hz):
uint32_t freq = SystemCoreClock;   // 84000000
(void)freq;
// Check in the debugger's Variables view
The 84U in measurement macros is based on this value.
Light travels about 30cm in 1ns. In one cycle (≈12ns), light travels roughly 3.6 meters. For an 84MHz CPU, the time it takes light to travel 3.6 meters is “the minimum step (one cycle).” In that one step, one instruction completes. Does that give you some feel for the “speed” of embedded?
“1 Instruction = 1 Cycle” Is Not Strictly True
Looking at the reference table, you might think “then I can count all the instructions and get the exact time.” It’s not that simple.
Modern microcontrollers have Flash (non-volatile memory that stores the program) that can’t keep up with the CPU clock, so reading an instruction may require waiting a few cycles.
CPU reading instructions from Flash:

Cycle     1      2      3      4      5
CPU:   |read | exec  |read | exec  |...
Flash: |slow!|slow!|

→ Flash can't keep up, CPU waits during the gap
To prevent this, most microcontrollers have an instruction cache. Instructions read once are saved in the cache and can be executed in the next iteration without waiting.
The practical result:
- Straight-line code (inside loops, etc.) → cache works effectively, ≈ 1 instruction per cycle
- Branches, jumps, interrupt entries → cache misses occur, adding a penalty of several cycles
| Situation | Cycles per instruction | Cause |
|---|---|---|
| Ideal (straight-line code) | ≈ 1 cycle | Instruction cache working perfectly |
| Branch / jump | 1 + α cycles | Pipeline disruption (branch misprediction) |
| Flash wait state | 1 + N cycles | Memory read latency |
| Interrupt entry | +12 to dozens of cycles | Context save overhead (register push) |
Even if you calculate “this loop should take 1000 cycles,” the actual measurement might be 1010–1050 cycles, due to cache misses and interrupt overhead. When precision matters, measure instead of calculate — that’s why we use DWT CYCCNT.
Reference values at 84MHz:
| Operation | Cycles (rough) | Time (rough) |
|---|---|---|
Simple addition (a + b) |
1–2 | ≈ 12–24 ns |
| RAM read | 1 to a few | ≈ 12–60 ns |
| Flash read (with ART cache) | 1–5 | ≈ 12–60 ns |
GPIO operation (HAL_GPIO_WritePin) |
≈ 10–20 | ≈ 120–240 ns |
| SPI 8-bit transfer (1MHz clock) | ≈ 8,000 | ≈ 8 µs |
| UART 1 byte (115200bps) | ≈ 730 | ≈ 87 µs |
HAL_Delay(1) (1ms wait) |
≈ 84,457 | ≈ 1,005 µs |
HAL_Delay(1000) (1 second wait) |
≈ 84,000,000 | ≈ 1,000 ms |
All of these are numbers you can only know by measuring. How many cycles a single line of C consumes varies with compiler optimization, instruction cache, and memory access patterns. That’s why measurement is necessary.
⏰ Time-Measurement Tools for Embedded
There are three main methods for measuring execution time in embedded. Each has different resolution and use cases.
| Method | Resolution | Max measurement time | Use case |
|---|---|---|---|
| ms tick counter (HAL_GetTick, millis, etc.) | 1 ms | ≈49 days (32-bit) | Coarse timing, timeouts |
| Cycle counter (DWT CYCCNT, ESP32 cycle count, etc.) | 1 cycle (≈ few to tens of ns) | Tens of seconds (32-bit) | Precise µs–ms measurement |
| GPIO toggle + oscilloscope | Oscilloscope resolution | Unlimited | Waveform verification on real hardware |
Every microcontroller has equivalents of all three. Names and APIs differ, but the concept is universal.
The Limits of the ms Tick Counter
Every platform has a function that returns “how many milliseconds since boot”:
| Platform | Function |
|---|---|
| STM32 HAL | HAL_GetTick() |
| Arduino / ESP32 Arduino | millis() |
| ESP-IDF | esp_timer_get_time() (µs precision) |
| Renesas RA (FSP) | R_BSP_SoftwareDelay() / SysTick count |
All are convenient, but they have a fundamental limit: can’t measure anything shorter than 1ms.
/* STM32 example (same concept on other platforms) */
uint32_t start = HAL_GetTick();   // ms units
do_something();
uint32_t elapsed = HAL_GetTick() - start;
For operations that complete within 1ms (SPI transfers, computation loops, etc.), elapsed returns 0. When µs precision is needed, use the cycle counter below.
A down-counter built into Cortex-M. It counts down from a configured value and fires an interrupt when it reaches 0. Many frameworks (STM32 HAL, Arduino, FreeRTOS) use this at 1ms intervals. HAL_GetTick() and millis() simply return a counter that’s incremented on each such interrupt.
🔬 DWT CYCCNT — A Cycle-Precision Measurement Instrument
What is DWT (Data Watchpoint and Trace)?
DWT is a debug and trace hardware unit built into Cortex-M. Inside it is CYCCNT (Cycle Counter), a 32-bit counter that increments every CPU clock cycle.
DWT details are not in the STM32 reference manual (RM0xxx). They’re in ARM’s official “Cortex-M4 Devices Generic User Guide” or “ARM v7-M Architecture Reference Manual” — a Cortex-M series common specification. It applies to all microcontrollers with Cortex-M, not just STM32.
Breaking Up with printf Debugging
“Whenever I want to check execution time, I just put a printf in there” — the classic embedded trap.
// ❌ Trying to measure with printf
printf("start\n");
do_something();
printf("end\n");
// → printf itself consumes tens of thousands to hundreds of thousands of cycles (UART TX)
//   printf is heavier than the code you wanted to measure — the result is meaningless
This is a textbook example of the observer effect (the act of measuring changes the subject). At 115200bps, sending just one byte takes about 730 cycles. The 6 characters in "start\n" consume about 4,400 cycles.
DWT CYCCNT is a single register read — overhead is just a few cycles. “Don’t break what you’re measuring by measuring it” — that’s the primary reason to use DWT.
You can actually measure this overhead:
uint32_t s = DWT_START();
uint32_t overhead = DWT_CYCLES(s);   // measure the cost of this one line alone
overhead is typically 2–4 cycles. That’s the upper bound of the “ruler’s error” for your measurements.
DWT is a debug feature ARM has built into Cortex-M — it’s not STM32-specific. The same code works on any Cortex-M0+ or higher (nRF52, RP2040, Renesas RA, SAM, etc.). Note: Cortex-M0 does not have CYCCNT.
Equivalent cycle counters exist on non-Cortex-M platforms too:
- ESP32 (Xtensa):
xthal_get_ccount()oresp_cpu_get_cycle_count() - AVR (Arduino Uno): no hardware cycle counter; use a 16-bit timer as substitute
- RISC-V (ESP32-C3, etc.):
__builtin_riscv_rdcycle()
The names differ but the essence — “a counter that increments in sync with the CPU clock” — is the same everywhere.
Enabling CYCCNT
DWT is disabled by default. It must be enabled before use.
/* Enable DWT CYCCNT (call this once) */
void DWT_Init(void)
{
    /* ① Enable DWT via CoreDebug's DEMCR register */
    CoreDebug->DEMCR |= CoreDebug_DEMCR_TRCENA_Msk;

    /* ② Reset CYCCNT */
    DWT->CYCCNT = 0;

    /* ③ Start CYCCNT counting */
    DWT->CTRL |= DWT_CTRL_CYCCNTENA_Msk;
}
DEMCR (Debug Exception and Monitor Control Register) is a CoreDebug register that controls enabling/disabling debug features. Setting the TRCENA (Trace Enable) bit to 1 activates DWT, ITM, and other trace units. If this bit is 0, DWT->CYCCNT always reads as 0. If you’re getting “always 0” in your measurements, check this first.
Also: if it works with the debugger connected but always reads 0 when running standalone (no debugger), this happens in environments where debug peripheral clocking is only enabled when a debugger is attached. Verify that DWT_INIT() is always called in your code.
When migrating to Cortex-M7 (STM32H7 and other higher-end devices), you may need the unlock operation DWT->LAR = 0xC5ACCE55;. This is normally not required on the F401RE (Cortex-M4), but it’s a useful one to know when porting.
Creating Measurement Macros
Directly manipulating registers every time is verbose, so prepare measurement macros. Since #define is a preprocessor directive rather than code, /* USER CODE BEGIN PD */ (Private Define section) is the appropriate location — it survives CubeMX regeneration.
/* Write in USER CODE BEGIN PD in main.c */

/* DWT CYCCNT initialization */
#define DWT_INIT() do { \
    CoreDebug->DEMCR |= CoreDebug_DEMCR_TRCENA_Msk; \
    DWT->CYCCNT = 0; \
    DWT->CTRL |= DWT_CTRL_CYCCNTENA_Msk; \
} while(0)

/* Start and stop measurement */
#define DWT_START()           (DWT->CYCCNT)
#define DWT_CYCLES(start)     (DWT->CYCCNT - (start))

/* Cycles → µs conversion
 * Using 64-bit arithmetic (like CYCLES_TO_NS below) avoids
 * divide-by-zero for very low clocks (< 1MHz) where
 * (SystemCoreClock / 1000000U) would equal 0. */
#define CYCLES_TO_US(cycles)  ((uint32_t)((uint64_t)(cycles) * 1000000ULL / SystemCoreClock))

/* Cycles → ns conversion
 * 1ns = 1/10^9 s, so: cycles / SystemCoreClock * 10^9 = cycles * 10^9 / SystemCoreClock
 * 64-bit arithmetic prevents overflow of (cycles * 10^9)
 * and avoids divide-by-zero for clocks < 1MHz. */
#define CYCLES_TO_NS(cycles)  ((uint32_t)((uint64_t)(cycles) * 1000000000ULL / SystemCoreClock))
Wrapping multi-statement macros in do { ... } while(0) is a C idiom. It ensures the macro works correctly inside constructs like if (x) DWT_INIT();. You don’t need to understand it deeply to use it, but it’s also recommended for suppressing GCC warnings.
Both CYCLES_TO_US and CYCLES_TO_NS use SystemCoreClock directly. On a fixed 84MHz environment you could write cycles / 84 or cycles * 1000 / 84 and get the same result, but using the variable means no changes needed when the clock setting changes, and no divide-by-zero for very low clocks.
📐 Measuring in Practice
Experiment 1: How Many Cycles Does HAL_Delay(1) Use?
HAL_Delay(1) waits for 1ms. At 84MHz, the theoretical value is 84,000 cycles. Let’s measure the actual value.
Add the following to USER CODE BEGIN 2 and run in debug mode:
/* USER CODE BEGIN 2 */

DWT_INIT();   // enable DWT (always call this first)

/* --- Single measurement --- */
uint32_t start = DWT_START();

HAL_Delay(1);   // 1ms wait (how many cycles?)

uint32_t cycles = DWT_CYCLES(start);
uint32_t us     = CYCLES_TO_US(cycles);

/* Check cycles and us in the debugger's Variables view */
(void)cycles;
(void)us;

/* --- Measure multiple times to observe variance --- */
uint32_t results[10];
for (int i = 0; i < 10; i++) {
    uint32_t s = DWT_START();
    HAL_Delay(1);
    results[i] = DWT_CYCLES(s);
}
/* Check results array in Variables view */

/* USER CODE END 2 */
Set a breakpoint at the end of the results array block and expand the array in the Variables view.
⚠️ 画像が見つかりません: /posts/stm32-episode07/debug_dwt_variables.png
HAL_Delay(1) polls until HAL_GetTick() increases by at least 1. SysTick fires every 1ms to update the counter, but where in that period the function is called determines how long it waits.
- Called just before a tick: catches the very next tick → ≈ 84,000–85,000 cycles (≈ 1ms)
- Called just after a tick: waits through the current tick period and then waits for the next one → ≈ 168,000 cycles (≈ 2ms)
In other words, HAL_Delay(1) actually means “returns sometime between 1ms and 2ms.”
Actual measured values (NUCLEO-F401RE, 84MHz, -O0):
HAL_Delay(1) measurement results (10 runs, nearly consistent)
  cycles ≈ 167,965  (≈ 1,999 µs ≈ 2 ms)
  us     ≈ 1999

  Measurement variance: 167,945–167,990 (about 45 cycles ≈ 0.5 µs)
In this environment, the startup sequence length is nearly constant every time, and every call to HAL_Delay(1) arrives at the same phase (just after a SysTick). As a result it consistently waits almost exactly 2ms.
Depending on call timing, the range is 84,000–168,000 cycles (1–2ms). This is what “waits at least N ms” means.
HAL_Delay(N) means “wait at least N ms” — it’s not guaranteed to be exactly N ms. Using it for precise timing control is risky. Episode 8 on interrupts covers better alternatives.
Experiment 2: Measuring Execution Time of a Computation Loop
Experiment 1 measured “idle waiting” time. Now let’s measure “a loop that actually does computation.”
Rather than “idle waiting” like HAL_Delay, knowing how many cycles your own logic consumes is the starting point for identifying bottlenecks in embedded systems.
/* Target to measure: a simple computation loop */
uint32_t start = DWT_START();

uint32_t sum = 0;
for (int i = 0; i < 1000; i++) {
    sum += i;
}

uint32_t cycles = DWT_CYCLES(start);
uint32_t us     = CYCLES_TO_US(cycles);

(void)sum;
(void)cycles;
(void)us;
Actual measured values (NUCLEO-F401RE, 84MHz, -O0):
for loop 1000 iterations (-O0)
  sum    = 499500  (correct result of 0+1+...+999)
  cycles = 16018   (≈ 190 µs)
  us     = 190
16,018 cycles ÷ 84MHz = ≈ 190µs. Even if you thought “a 1000-iteration loop is instantaneous,” it takes 190µs in a debug build. This is what “you can’t know without measuring” means.
Experiment 3 next shows how dramatically this number changes in a release build.
⚠️ 画像が見つかりません: /posts/stm32-episode07/debug_dwt_loop.png
Change the loop count from 1000 to 10000 and measure again. The cycle count should be roughly 10×. If it’s not — what’s happening?
Experiment 3: How Does Optimization Level Change Things?
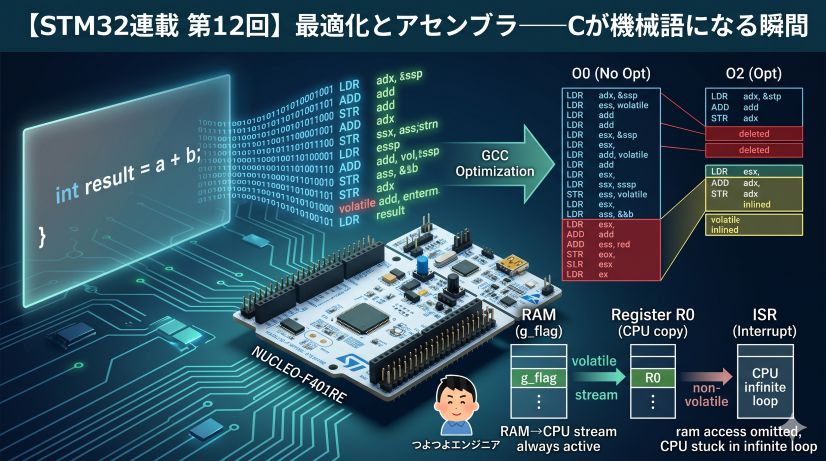
In Episode 6 we explained “optimization can delete your code.” Now we’ll confirm that effect as a real number in cycles.
The code is the same as Experiment 2, but add volatile to all variables so the compiler can’t eliminate them through optimization:
volatile uint32_t start = DWT_START();

volatile uint32_t sum = 0;
for (int i = 0; i < 1000; i++) {
    sum += i;
}

volatile uint32_t cycles = DWT_CYCLES(start);
volatile uint32_t us     = CYCLES_TO_US(cycles);
In a Release build (-O2), variables the debugger doesn’t access are kept in registers and won’t appear in the Variables view. Adding volatile forces writes to RAM, making values visible from the debugger. However, making sum itself volatile forces a RAM access on every iteration, which prevents accurate measurement of the optimization effect. We’re adding it here specifically because “we want to see the measurement results.”
How to switch to Release build (STM32CubeIDE):
- Right-click the project in Project Explorer → Build Configurations → Set Active → Release
- Project → Properties → C/C++ Build → Settings → MCU GCC Compiler → Debugging → Set Debug level to
-g2(needed for source mapping) - Project → Clean… → Clean all
- Ctrl+B to rebuild
- Run → Debug Configurations → Change “C/C++ Application” to
Release/ProjectName.elf - Start debug execution
Actual measured values (NUCLEO-F401RE, 84MHz):
| Build | cycles | us | Notes |
|---|---|---|---|
| Debug (-O0) | 16,018 | 190 | Loop executed faithfully |
| Release (-O2) | 8,011 | 95 | Optimization cuts it roughly in half |
With -O2, volatile forces a RAM read/write on every iteration, so the loop isn’t completely eliminated — resulting in 8,011 cycles.
Removing all volatile at -O2 causes the compiler to judge that sum’s result is not used externally and delete the entire loop. cycles measures just a few to a dozen cycles. This is the concrete reality of “optimization deletes code” explained in Episode 6.
⚠️ 画像が見つかりません: /posts/stm32-episode07/debug_dwt_comparison.jpg
Try measuring HAL_GPIO_WritePin from the reference table. Verify whether the “≈ 10–20 cycles” figure actually appears.
🔌 Measuring with GPIO Toggle + Oscilloscope
DWT CYCCNT requires the debugger, but when you want to observe waveforms on real running hardware, GPIO toggle is effective.
How to Do It
/* Measurement start: set GPIO High */
HAL_GPIO_WritePin(GPIOA, GPIO_PIN_5, GPIO_PIN_SET);

/* ← run the code you want to measure here → */
uint32_t sum = 0;
for (int i = 0; i < 1000; i++) {
    sum += i;
}
(void)sum;

/* Measurement end: set GPIO Low */
HAL_GPIO_WritePin(GPIOA, GPIO_PIN_5, GPIO_PIN_RESET);
Connect an oscilloscope (or logic analyzer) to any GPIO pin and measure how long it stays High. On STM32, PA5 (user LED) is convenient. For Arduino use digitalWrite(), for ESP-IDF use gpio_set_level() — the same technique applies.
The GPIO functions themselves consume a few cycles. When the code you’re measuring is short, that overhead becomes non-negligible. Use the cycle counter when µs-or-better precision is needed, and use GPIO toggle for confirming ms-order behavior.
⚠️ DWT CYCCNT Caveats
Overflow
CYCCNT is a 32-bit counter. At 84MHz it overflows (wraps to 0) in about 51 seconds.
2^32 ÷ 84,000,000 Hz ≈ 51.1 seconds
For operations that complete within 51 seconds this is not a problem. For long-running measurements, unsigned integer subtraction handles wrap-around correctly:
uint32_t cycles = end - start;   // correct even if start > end (overflow occurred)
                                   // requires the measured interval to be under 51 seconds
Not Limited to Debug Builds
DWT CYCCNT works in release builds too. It also works on real hardware without the debugger attached. You can remove the (void)cycles line and output via UART or LED.
Interrupts Add to the Count
If an interrupt fires during the measurement interval, those cycles are added to CYCCNT. For precise measurements, consider temporarily disabling interrupts:
__disable_irq();   // disable interrupts
uint32_t start = DWT_START();

/* code to measure */

uint32_t cycles = DWT_CYCLES(start);
__enable_irq();    // re-enable interrupts
While __disable_irq() is active, SysTick interrupts are also halted, so HAL_GetTick() stops advancing. Calling HAL_Delay() inside the disabled interval will cause an infinite loop. Keep interrupt-disabled sections as short as possible (a few µs at most), and avoid calling HAL timeout APIs inside them.
🏭 Practical Scenarios: What Measurement Reveals
DWT CYCCNT isn’t just a learning toy — it’s used in real development like this.
Scenario 1: “Is This ISR Meeting Its Deadline?”
An ISR (Interrupt Service Routine) is the function called automatically when an interrupt fires. Details come in Episode 8, but for now think of it as “a handler called on a fixed schedule.”
If you’re doing work inside a 1ms timer interrupt, the ISR’s execution time must not exceed 1ms (or it won’t complete before the next interrupt).
void TIM2_IRQHandler(void)
{
    uint32_t start = DWT_START();

    /* Interrupt handler work */
    HAL_TIM_IRQHandler(&htim2);
    do_some_work();

    uint32_t cycles = DWT_CYCLES(start);
    /* If cycles exceeds 84,000, processing is too heavy */
    if (cycles > 84000) {
        /* Error handling, warning LED, etc. */
        HAL_GPIO_WritePin(GPIOA, GPIO_PIN_5, GPIO_PIN_SET);
    }
}
Scenario 2: “How Many µs Does the SPI Transfer Take?”
Measuring the time to read sensor data over SPI:
uint32_t start = DWT_START();

HAL_SPI_TransmitReceive(&hspi1, tx_buf, rx_buf, 4, HAL_MAX_DELAY);

uint32_t cycles = DWT_CYCLES(start);
uint32_t us     = CYCLES_TO_US(cycles);
/* us holds the actual SPI transfer time */
For a 4-byte transfer at SPI clock 1MHz, the theoretical value is 32µs. If the measurement shows 35µs, that means HAL overhead is 3µs.
Scenario 3: Identifying Where the Bottleneck Is
When measuring a large operation, measure each part separately and compare to identify the bottleneck:
uint32_t t0 = DWT_START();
step_A();
uint32_t t1 = DWT_START();
step_B();
uint32_t t2 = DWT_START();
step_C();
uint32_t t3 = DWT_START();

uint32_t cyc_A = t1 - t0;
uint32_t cyc_B = t2 - t1;
uint32_t cyc_C = t3 - t2;
/* Which step is heaviest is now a number, not a guess */
Instead of “I think step_B is probably slow,” you can say “step_B takes 1,200 cycles, step_C takes 200 cycles.” That is the measurement culture.
| Situation | Method |
|---|---|
| Timeouts, ms-order delays | ms tick counter (HAL_GetTick / millis, etc.) |
| Precise µs–ms measurement | Cycle counter (DWT CYCCNT / esp_cpu_get_cycle_count, etc.) |
| Waveform verification on real hardware, ms-order confirmation | GPIO toggle + oscilloscope/logic analyzer |
| Very short intervals, interrupt-free environment | Cycle counter + interrupt disable |
“Measure Before Discussing” Culture
In the embedded engineering world, “probably fast” and “probably on time” don’t hold up.
- “How many µs does this loop take?” → Measure, then answer
- “Did the optimization make it faster?” → Measure and compare before and after
- “Is the interrupt response time acceptable?” → Measure and confirm
DWT CYCCNT is the first tool for exactly this. The habit of measurement you’ve built today will be essential in every upcoming episode — interrupts, DMA, RTOS.
Summary
What we learned this episode:
- Clock frequency → NUCLEO-F401RE runs at 84MHz. 1 cycle ≈ 12ns
- HAL_GetTick() → 1ms resolution. Good for timeouts and delay management
- DWT CYCCNT → 1-cycle resolution. Ideal for precise µs-level measurement
- GPIO toggle → waveform confirmation with an oscilloscope. Convenient for ms-order real-hardware checks
- Measurement culture → discuss with “measured values,” not “probably”
Optimizing without knowing what’s slow just makes the wrong place faster. First measure, identify the bottleneck, then optimize only that — this is the craft of the embedded professional. (Donald Knuth’s words, applied to embedded.)
The next episode enters “what are interrupts?” — the core technology for actively controlling the world of time.
What’s Next
⚡ Episode 8: Understanding Interrupts — Vector Table, NVIC, Context Saving, and TIM2 Implementation
What's wrong with polling when you need to "do something every 1ms"? Understand the vector table, NVIC, and context saving — then generate a 1ms periodic event with TIM2 interrupts.
Read Episode 8 →