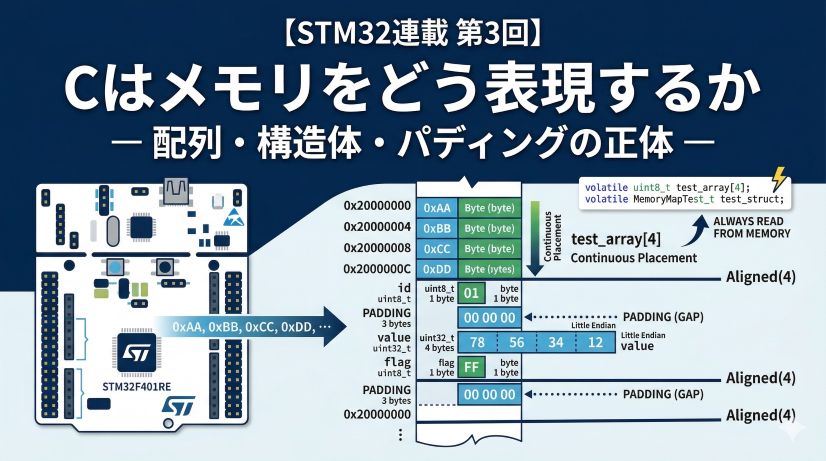
This episode observes — through real debugger addresses — where data lands based on how variables are declared. Building on Episode 1’s principle that “everything is managed by address,” the goal is to understand the three major memory regions — Flash, SRAM, and Stack — and when to use each.
In Episode 1, we tracked the location of executing instructions using the program counter. Now we focus on where data is stored.
📖 Previous Episode
#1: The Microcontroller Is an "Address World" — Understanding Hardware Through Coordinates
📘 Next Episode
📍 Series Index
✅ What You'll Be Able to Do After This Episode
- Describe the layout and role of the STM32F401 memory map (Flash / SRAM / peripheral registers)
- Explain which memory region each of
const, global, and local variables lands in - Verify a variable's actual address using the debugger's Expressions view
- Understand why the stack grows downward from the top of RAM
- Make informed decisions about when to use non-volatile (Flash) vs volatile (SRAM) storage
Table of Contents
- The STM32 Memory Map — Reading the Microcontroller’s Blueprint
- C Variable Declarations and Memory Placement
- Observing Memory Addresses with the Debugger
- How the Stack Works
- Observing Raw Bytes in the Memory View
- Hands-On: Experiencing the Three Regions
- Summary: Understanding the “Address” of a Variable
1. The STM32 Memory Map — Reading the Microcontroller’s Blueprint
1-1. Every Resource Is Managed by Addresses
In Episode 1, we learned that the microcontroller manages all resources — instructions, data, peripherals — through addresses. But this address space isn’t randomly organized.
In practice, it follows a memory map — a design document that divides the space into regions by purpose. Like a city divided into districts, the microcontroller’s address space has defined zones.
1-2. STM32F401 Memory Map Structure
The address space of the STM32F401 (used on many development boards) is rigidly partitioned. This isn’t something we decide — the chip’s designers determined “what lives at which address” at design time, documented in the Reference Manual published by ST Microelectronics.
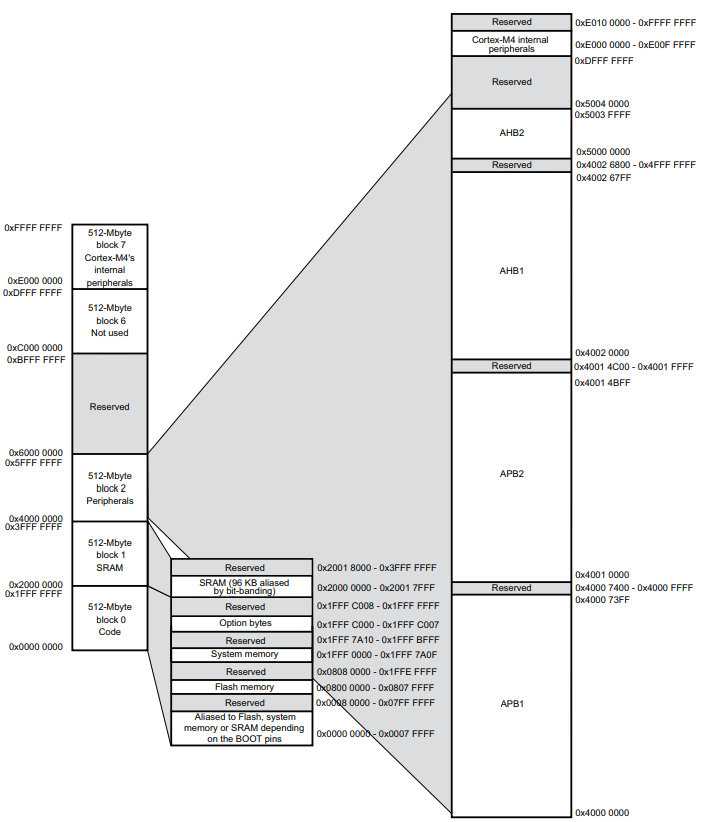 The memory map from the STM32F4xx Reference Manual. This blueprint is the authority for every address.
From this map, three main regions:
- Code region (0x0800 0000 onward): Flash memory. Where programs and constants live — “the permanent city.” Contents survive power-off.
- SRAM region (0x2000 0000 onward): Where variables live — “the working city.” Fast read/write, but contents are lost at power-off.
- Peripherals region (0x4000 0000 onward): “Control switches” for GPIO, timers, and other hardware. Write to a specific address and the hardware responds.
Memory Region Summary
| Address Range | Region | Memory Type | Primary Use | Characteristic |
|---|---|---|---|---|
| 0x0800 0000 onward | Flash | Non-volatile | Program code, constant data | Survives power-off; limited write cycles |
| 0x2000 0000 onward | SRAM | Volatile | Variables, dynamic data | Very fast; contents lost at power-off |
| 0x4000 0000 onward | Peripheral registers | Memory-mapped I/O | Control GPIO, UART, timers | Write to address → hardware acts |
1-3. Non-Volatile vs Volatile
-
Non-volatile (Flash, EEPROM): Content persists through power loss. Used for program code and unchanging configuration. Write cycles are limited (tens of thousands to hundreds of thousands); writes are slow, reads are fast.
-
Volatile (SRAM, DRAM): Content is lost at power-off. Used for variables and data that changes frequently during execution. Very fast, no write-cycle limit.
Everyday analogy:
Your phone’s internal storage (SSD) is non-volatile — apps stay installed after reboot. RAM is volatile — data in a running app is lost when you power off.
1-4. Why Separate Regions?
Using different physical memory types where they fit best provides:
- Efficiency: Expensive, fast SRAM kept to the minimum needed; cheap, high-capacity Flash for the primary program store.
- Reliability: Frequently-written data in SRAM; persistent data in Flash.
- Safety: Keeping program code in Flash prevents accidental overwrite by bugs.
2. C Variable Declarations and Memory Placement
2-1. Declaration → Section → Memory Region
In C, where and how you declare a variable determines which memory section (and therefore which physical region) it lands in.
| Declaration | Section | Memory Region | Example Address | Lifetime | Use |
|---|---|---|---|---|---|
const type var |
.rodata | Flash | 0x0800… | Entire program | Read-only constants |
| Global var (initialized) | .data | Flash → SRAM | 0x2000… | Entire program | Shared across functions |
| Global var (uninitialized) | .bss | SRAM | 0x2000… | Entire program | Large buffers |
| Local var (inside function) | (Stack) | SRAM | 0x2001… (high) | During function only | Temporary calculation data |
Important:
.datavariables (initialized globals) use both Flash and SRAM — initial values are stored in Flash and copied to SRAM at startup..bssvariables (uninitialized globals) use only SRAM — saving Flash space.
2-1-1. What Are Sections? — .data vs .bss
When you compile a program, variables and code are grouped into sections — collections of data with similar characteristics.
The linker (the tool that combines compiled files into one executable) decides memory placement at the section level.
Section name origins:
.data,.bss,.textfollow a naming convention from UNIX. The leading period indicates a “system-managed special region.”
Major sections:
| Section | Contents | Memory | Characteristic |
|---|---|---|---|
| .text | Program code (machine instructions) | Flash | The instructions themselves |
| .rodata | Read-only data (const, string literals) | Flash | Data that never changes |
| .data | Initialized global variables | Flash → SRAM | Copied from Flash to SRAM at startup |
| .bss | Uninitialized / zero-initialized globals | SRAM | Zeroed at startup |
Why split globals into .data and .bss?
.data section (initialized global variables)
int counter = 10;           // has initial value → .data
uint32_t flag = 0x1234;     // has initial value → .data
Flow:
- At compile time: initial values (10, 0x1234) are stored in Flash
- At startup: initial values are copied from Flash to SRAM
- During execution: reads and writes happen in SRAM
Why this double-storage?
Flash is non-volatile so it can permanently hold initial values, but writes are slow. During execution, variables are operated on in fast SRAM. At next power-on, initial values are restored from Flash.
.bss section (uninitialized global variables)
int counter;                // no initial value → .bss (automatically 0)
uint32_t buffer[256];       // no initial value → .bss (all 0)
Flow:
- At compile time: nothing to store — everything will be 0
- At startup: SRAM region is zeroed out
- During execution: reads and writes happen in SRAM
Why separate .data and .bss?
Variables that are always 0 don’t need their “0” stored in Flash — just zero out the SRAM region at startup. For large arrays, this saves significant Flash space.
Flash usage comparison:
// Case 1: initialized (.data section)
uint8_t large_array_data[1024] = {1, 2, 3, ...};
// → Uses 1024 bytes of Flash AND 1024 bytes of SRAM

// Case 2: uninitialized (.bss section)
uint8_t large_array_bss[1024];
// → Uses 0 bytes of Flash; 1024 bytes of SRAM (zeroed at startup)
In embedded systems with limited Flash, placing large buffers in .bss is a meaningful optimization.
Startup section initialization:
Before main() is called, the startup code (startup_stm32f4xx.s) automatically:
- Copies
.datainitial values from Flash to SRAM - Zeroes the
.bssregion - Initializes the Stack pointer
- Calls
main()
This is why you can start writing code in main() without worrying about initialization.
2-2. Experiment Code
/* Global scope: variables visible across the whole program */
const uint32_t flash_const = 0xDEADBEEF;        // .rodata → Flash
volatile uint32_t ram_global_init = 0x12345678;  // .data → Flash → SRAM (initialized)
volatile uint32_t ram_global_uninit;             // .bss → SRAM (uninitialized, auto 0)

/* Local variable inside a function: temporary resident */
void stack_test_function(uint32_t depth) {
    // Stack: local variable that only exists while the function runs
    volatile uint32_t stack_local = depth;
    stack_local = stack_local;  // prevent optimizer removal
    if (depth > 0) {
        stack_test_function(depth - 1);  // recursive call to grow the stack
    }
}

int main(void) {
    HAL_Init();

    // Get flash_const's address (prevents optimization)
    volatile const uint32_t* p_flash_const = &flash_const;

    // Call to observe stack growth
    stack_test_function(3);

    while(1) {
        ram_global_init++;    // increment .data variable
        ram_global_uninit++;  // increment .bss variable
        HAL_Delay(1000);
    }
}
Role of each code element:
| Element | Role and placement |
|---|---|
const |
Declares a constant placed in Flash (0x08…). Value survives power-off. |
volatile |
Prevents compiler optimization so the debugger can reliably observe the variable. Details in Episode 3. |
ram_global_init = 0x12345678 |
Has initial value → .data section (uses Flash) |
ram_global_uninit |
No initial value → .bss section (saves Flash) |
stack_test_function(depth - 1) |
Recursive calls let us watch the stack grow. 3 levels deep means stack_local exists at 3 different addresses simultaneously. |
p_flash_const = &flash_const |
Storing the address in a pointer prevents the compiler from optimizing it away. Pointers covered in detail in later episodes. |
constvsvolatile:
flash_constintentionally has novolatile— this ensures it stays in Flash.ram_global_initandstack_localusevolatileto allow SRAM observation. Detailed modifier usage in Episode 3.
3. Observing Memory Addresses with the Debugger
3-1. Using the Expressions View
STM32CubeIDE’s debugger has an Expressions view that shows not just values but also addresses.
Steps:
- Start debugging and stop at a breakpoint inside
stack_test_function() - Window → Show View → Expressions
- Click Add new expression and enter:
&flash_const— address of the const variable&ram_global_init— address of the .data global&ram_global_uninit— address of the .bss global&stack_local— address of the local variable
The
&operator:
In C,&is the “address-of operator” — it retrieves the memory address where a variable is stored. Ifint x = 10;, thenxis the value 10, and&xis the address where x lives (e.g.,0x20000100).
3-2. What the Addresses Tell You
When you check the Expressions view, you’ll see results like:
| Variable | Address | Region | Section |
|---|---|---|---|
&flash_const |
0x0800 17a8 | Flash | .rodata |
&ram_global_init |
0x2000 0000 | SRAM | .data (initialized) |
&ram_global_uninit |
0x2000 002c | SRAM | .bss (uninitialized) |
&stack_local |
0x2001 7fe4 | SRAM (Stack) | — |
(Actual addresses vary by environment)
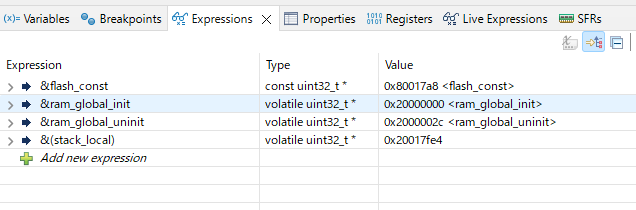 The Expressions view confirms that each variable type lands in a different memory region.
3-3. What the Addresses Mean
-
Flash (0x08…): flash_const
constvariables land in Flash (.rodata). Value survives power-off; read-only during execution. -
SRAM low (0x2000…): ram_global_init (.data)
Initialized globals land in low SRAM. At startup, initial values are copied from Flash. Same address for the entire program lifetime — fast read/write. -
SRAM low (0x2000…): ram_global_uninit (.bss)
Uninitialized globals land in low SRAM, zeroed at startup. Often placed just after the .data region. -
SRAM high (0x2001…): stack_local
Local variables land in high SRAM (Stack region). Allocated when the function is called, released when it returns. Recursive calls get different addresses for each level.
Key difference:
Global variables (ram_global_init, ram_global_uninit) exist for the entire program — you can keep incrementing them in while(1). Local variables (stack_local) are gone when the function returns; they cannot hold values across calls.
4. How the Stack Works
4-1. What Is the Stack?
The stack is a region for storing temporary data needed during function execution. Like a stack of books — you can only take from the top; to reach a lower book you must remove those above it. This is LIFO (Last In, First Out).
4-2. Stack Mechanics
When a function is called:
- On function call: allocate stack space for local variables (Push)
- During execution: read/write local variables on the stack
- On function return: release that stack space (Pop)
void main(void) {
    int a = 10;   // allocated on stack
    func();       // func() is called
    // ← after func() returns, func()'s locals are released
    a = a + 1;    // 'a' still exists on the stack
}

void func(void) {
    int b = 20;   // allocated on stack (above 'a')
    b = b + 1;
}  // ← b is released when func() returns
Recursive example (stack_test_function):
void stack_test_function(uint32_t depth) {
    volatile uint32_t stack_local = depth;  // allocated at e.g. 0x2001 7FF0
    stack_local = stack_local;

    if (depth > 0) {           // ★ recommended breakpoint ★
        stack_test_function(depth - 1);  // recursive call
    }
}  // ← stack_local released here
Calling stack_test_function(3) creates nested calls:
stack_test_function(3)→stack_local = 3at 0x2001 7FF0stack_test_function(2)→stack_local = 2at 0x2001 7FE8stack_test_function(1)→stack_local = 1at 0x2001 7FE0stack_test_function(0)→stack_local = 0at 0x2001 7FD8- Recursion ends; functions return in reverse order
Why does each level get a different address?
All four function invocations are simultaneously active. stack_test_function(3) hasn’t returned yet — it’s waiting for stack_test_function(2) to return. If they shared an address:
stack_test_function(3): stack_local = 3 at 0x2001 7FF0
  ↓ calls nested function
stack_test_function(2): stack_local = 2 written to same 0x2001 7FF0
  ↓ the value 3 is overwritten with 2
  ↓ when returning...
stack_test_function(3) resumes
  ↓ but stack_local is now 2, not 3
  ↓ worse: the return address was also overwritten
→ program can't return correctly, runs wild
The stack preserves the entire nested call context:
- Each level’s local variables:
stack_local = 3, 2, 1, 0coexist at separate addresses - Each level’s return address: “where to return when this function ends”
- Each level’s saved registers: CPU register values temporarily stored
All of this is preserved at different addresses per level — which is why the stack grows as calls deepen.
Measured: Watching the Stack Grow
| Call level | depth |
&stack_local address |
Change |
|---|---|---|---|
| 1st | 3 | 0x20017fe4 | (baseline) |
| 2nd | 2 | 0x20017fcc | −24 bytes (0x18) |
| 3rd | 1 | 0x20017fb4 | −24 bytes (0x18) |
| 4th | 0 | 0x20017f9c | −24 bytes (0x18) |
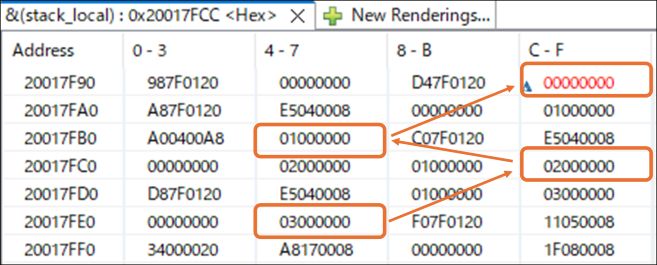 The stack grows downward — addresses decrease with each deeper function call.
What this data shows:
-
The stack grows downward: Addresses decrease from
0x...fe4→0x...fcc. The stack consumes RAM from the top (high addresses) toward the bottom (low addresses). -
24 bytes per call (not just 4): The local variable is 4 bytes, so why 24? The extra 20 bytes are invisible management data:
stack_local: 4 bytes (the visible part)- Return address: 4 bytes — “where to return when this function ends”
- Saved registers: 16 bytes — CPU register state saved so it can be restored on return
Each function call automatically sticks a “sticky note” on the stack: the complete state before the call, so return is guaranteed.
-
Stack overflow hazard: If you forget the termination condition (
if (depth > 0)) and call recursively forever, addresses keep decreasing until the stack hits the global variable region near0x20000000— corrupting data. That’s a stack overflow.
4-3. The Stack Pointer Register
The CPU uses a special register called the Stack Pointer (SP) to track the current “top” of the stack. Each function call decrements SP (stack grows from high to low addresses); each return increments SP.
Watch the sp register in the Registers view to see SP change with each function call.
Stack Overflow note:
Stack space is finite. Withdepth = 3it’s shallow — butstack_test_function(1000)would exhaust the stack and crash. Same if you declare large arrays as local variables. Monitor the Stack Pointer in the debugger to track stack usage.
5. Observing Raw Bytes in the Memory View
5-1. Why Use the Memory View?
The Expressions view shows variables in human-readable form. But to understand how data is physically stored in memory, you need the Memory view — which shows raw bytes.
This is where STM32’s little-endian byte order becomes visible. Understanding endianness matters when working with binary data or directly manipulating hardware registers.
5-2. Using the Memory View
Steps:
- Set a breakpoint at
stack_test_function(3);inmain()and stop there. - Window → Show View → Memory
- In the address field at the top, type
&flash_const
Tip:
You can enter variable expressions (&flash_const) directly — no need to first look up the address in the Expressions view.
5-3. The Little-Endian Surprise
Looking at address 0x0800 17a8 in the Memory view:
Address    | +0 +1 +2 +3 | +4 +5 +6 +7 |
-----------+-------------+-------------+
0x080017A8 | EF BE AD DE | ?? ?? ?? ?? |
We assigned 0xDEADBEEF to flash_const, but the Memory view shows EF BE AD DE — the bytes appear reversed. This is correct behavior.
Why does it appear reversed?
STM32 (ARM architecture) uses little-endian byte order — the least significant byte is stored at the lowest address.
- Value in program:
0xDEADBEEF - Bytes broken apart:
DE,AD,BE,EF(most significant first) - Memory storage order:
EF,BE,AD,DE← reversed!
| Address | Byte stored | Meaning |
|---|---|---|
| 0x080017A8 | EF |
Least significant byte |
| 0x080017A9 | BE |
2nd byte |
| 0x080017AA | AD |
3rd byte |
| 0x080017AB | DE |
Most significant byte |
The Memory view shows these consecutive bytes as EF BE AD DE.
The rule:
- Expressions view:
flash_const→0xDEADBEEF(CPU converts automatically — no confusion) - Memory view: raw bytes, so it appears reversed as
EF BE AD DE
Conclusion:
When reading and writing through C variables, the CPU handles conversion automatically — you don’t need to think about endianness. But when debugging with the Memory view, bytes appear in reverse order. This is not a bug; it’s correct STM32 behavior.
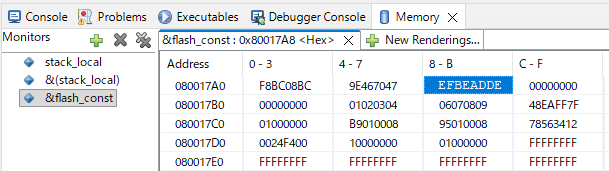 Memory view confirms little-endian storage: program value
 0xDEADBEEF appears as EF BE AD DE in memory.
5-4. Observing the Flash Region
Constants in Flash retain their value through power cycles. During execution, they are read-only — overwriting them is not possible.
Compare Flash (0x08…) and SRAM (0x20…) in the Memory view:
- Flash: value is fixed until the program is re-flashed
- SRAM: value changes during execution; lost at power-off
Also observe &ram_global_init — watch it change each iteration of the while(1) loop as the variable increments.
6. Hands-On: Experiencing the Three Regions
6-1. Constants in Flash
const uint32_t flash_const = 0xDEADBEEF;
const char message[] = "Hello, STM32!";

int main(void) {
    HAL_Init();

    volatile const uint32_t* p_flash_const = &flash_const;
    const char *ptr = message;  // pointer to first character of the string

    stack_test_function(3);  // ★ recommended breakpoint ★

    while(1) {
        ram_global_init++;
        HAL_Delay(1000);
    }
}
Check in Expressions view:
&flash_const→0x08...(Flash region)p_flash_const→0x08...(holds the Flash address)&message→0x08...(Flash region)message[0]→'H'(0x48)
Constant data is stored in the same Flash region as program code — it survives power-off. In embedded systems, storing configuration values and message tables in Flash preserves the limited SRAM for runtime data.
On pointers:
&flash_constretrieves the address of theflash_constvariable. Storing that in a pointer variablep_flash_constlets you carry the “where something lives” information around. Full pointer mechanics are in Episodes 4+. For now: a pointer is a variable that holds an address.
6-2. Global vs Local Variables
uint32_t global_counter = 0;  // SRAM (.data)

void increment(void) {
    uint32_t local_counter = 0;  // Stack

    global_counter++;         // ★ recommended breakpoint ★
    local_counter++;

    // In debugger:
    // global_counter address: 0x2000... — fixed
    // local_counter address: 0x2001... — may vary between calls
}

int main(void) {
    HAL_Init();

    increment();  // 1st call: global_counter=1, local_counter=1
    increment();  // 2nd call: global_counter=2, local_counter=1 (reset)

    while(1) {
        ram_global_init++;
        HAL_Delay(1000);
    }
}
After two calls:
global_counter: 1 → 2 (SRAM value persists between calls)local_counter: resets to 0 → 1 each call (new allocation each time)
| Variable | Address | Behavior |
|---|---|---|
global_counter |
0x2000 0XXX (fixed) | Same address throughout the program |
local_counter |
0x2001 XXXX (varies) | Stack position may vary per call |
7. Summary: Understanding the “Address” of a Variable
This episode used actual debugger addresses to observe the relationship between C variable declarations and memory placement.
Key Takeaways
-
Flash (0x08…):
.textsection: program code (machine instructions).rodatasection:constvariables- Non-volatile — survives power-off
- Read-only during execution
-
SRAM low (0x20…):
.datasection: initialized globals (copied from Flash at startup).bsssection: uninitialized globals (zeroed at startup)- Fast read/write
- Volatile — lost at power-off
-
SRAM high (stack, 0x2001…):
- Local variables
- Automatically allocated on function call, released on return
- No named section
Flash savings tip:
Declare large buffers without initial values to place them in.bss— they use zero Flash.
Debug Tools
- Expressions view: convenient address verification for variables
- Memory view: direct raw byte observation (watch for little-endian reversal)
- Registers view: monitor the Stack Pointer (SP) for stack usage
The Three Dimensions to Track
For any variable, ask three questions:
- Space (Where): Flash, SRAM low (.data/.bss), or SRAM high (stack)?
- Time (When): Exists for the entire program, or only while the function runs?
- Initialization (How): Copied from Flash? Zeroed? Uninitialized?
Understanding where variables live in time and space is the foundation for safe pointer operations — which are the subject of the upcoming episodes.
💡 What You Learned in This Episode
- STM32 memory map structure (Flash/SRAM/peripheral registers) and how to read the Reference Manual
- Sections (.text/.rodata/.data/.bss) and what each does
- Mapping variable declarations (const/global/local) to memory regions
- The difference between .data and .bss (initial value presence and Flash usage)
- When to use const vs volatile (Flash placement vs SRAM placement)
- Lifetime difference between global and local variables (persistent vs temporary)
- How the stack works and memory management during function calls (Push/Pop)
- Using the debugger (Expressions/Memory views) to verify real addresses
- Memory view gotcha: bytes appear in reverse order due to little-endian storage
- The address-of operator (&) and preventing compiler optimization
References
- STM32F401xD/xE Datasheet (PDF) — Electrical specs, pin layout, memory configuration
Datasheet vs Reference Manual:
- Datasheet: Summary of chip specs (memory size, operating voltage, pin layout)
- Reference Manual: Detailed peripheral usage, register configuration (typically 1000+ pages)
In embedded development, use the datasheet for the big picture and the reference manual for implementation details.
📖 Previous
#1: The Microcontroller Is an "Address World" — Understanding Hardware Through Coordinates
📍 Series Index