Introduction
I’ve been running an NVIDIA RTX A4000 (Ampere) for AI/ML and CAD work. As larger models and higher-resolution image generation became part of my daily workflow, VRAM limits and throughput ceilings were increasingly noticeable.
The decision: upgrade to an RTX PRO 4000 Blackwell (GB203 / 5nm). This article covers comprehensive benchmarks across AI inference, image generation, CAD, and as a bonus — gaming. Every number here comes from actual hardware running on my desk.
🖥 Test System
Hardware
- CPU: AMD Ryzen 9 5900X (12-core / 24-thread)
- RAM: 64 GB DDR4
- OS: Windows 11 Pro
- Motherboard: PCIe 5.0 compatible
Primary Workloads
- AI / Machine Learning: LLM inference experiments, fine-tuning
- Image Generation: Stable Diffusion / SDXL high-resolution output
- CAD: Mechanical design, 3D modeling
- Other: Data analysis, simulation
📊 Spec Comparison
| Spec | RTX A4000 (Ampere) | RTX PRO 4000 Blackwell | Delta |
|---|---|---|---|
| GPU Architecture | GA104 (8nm) | GB203 (5nm) | Newer node |
| CUDA Cores | 6,144 | 8,960 | +45.8% |
| VRAM | 16 GB GDDR6 | 24 GB GDDR7 (Hynix) | +50% |
| Memory Bus | 256-bit | 192-bit | −25% |
| Memory Bandwidth | 448 GB/s | 672.0 GB/s | +50% |
| TDP | 140 W | 145 W | +5 W |
| PCIe Interface | Gen 4 x16 | Gen 5 x16 | Latest gen |
- ~1.5× more CUDA cores — significant parallel processing gain
- 24 GB VRAM — headroom for large models and SDXL high-res generation
- GDDR7 memory — 1.5× memory bandwidth over GDDR6
- PCIe 5.0 — future-proofed for next-gen bandwidth demands
Why the RTX PRO 4000 Exists: The 1-Slot Revolution
The RTX PRO 4000’s most important physical characteristic is its single-slot thickness. When GeForce RTX 4080/4090 occupy 3+ slots and even high-end workstation GPUs default to 2-slot designs, the thin profile delivers real advantages.
Model Variants
| Model | Slot Width | TDP | Aux Power | Best For |
|---|---|---|---|---|
| Standard | 1-slot | 145 W | Required | Maximum performance, multi-GPU builds |
| SFF | 2-slot | ~70 W | Not required | Power efficiency, compact systems |
Standard (145 W): All benchmarks in this article use this model. Choose it for maximum throughput, multi-GPU NVLink configurations, or any situation where raw performance is the priority.
SFF (~70 W): Roughly half the power draw, runs on PCIe slot power alone — no aux cables. Ideal for small-form-factor cases, 24/7 AI servers watching electricity costs, and quiet builds.
Multi-GPU Density
On a standard ATX motherboard, the 1-slot form factor lets you stack two or three RTX PRO 4000s side by side — giving you a 48 GB or 72 GB VRAM pool in the space that one GeForce flagship occupies.
- 2-card (48 GB): Run Llama 70B-class models without quantization
- 3-card (72 GB): Parallel SDXL instances or extreme-resolution rendering
NVLink VRAM Pooling
Unlike GeForce (where NVLink was removed in the Ada generation), the RTX PRO 4000 Blackwell supports NVLink. Connected GPUs expose their VRAM as a unified memory pool — dramatically higher transfer bandwidth than PCIe, removing a major bottleneck for large model inference and training across cards.
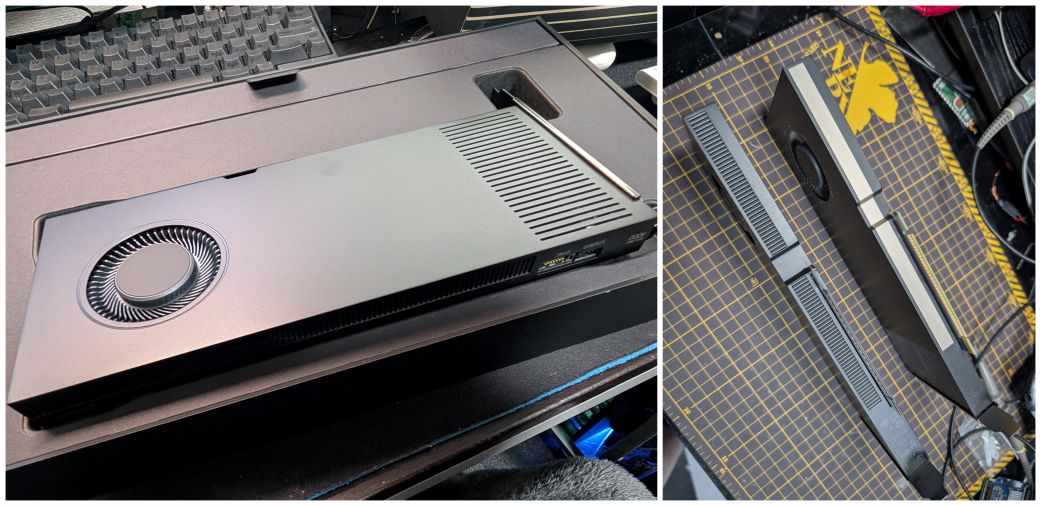
RTX PRO 4000 Blackwell (single-slot thickness)
🤖 AI / Machine Learning: Llama 3.1 8B Inference
Test Setup
Ollama (local LLM runtime) running Llama 3.1 8B (Meta’s 8B-parameter model). Same prompt, 5 consecutive runs — measuring both peak and sustained performance.
- t/s (tokens/sec): How many tokens the GPU processes per second. Higher = faster.
- Prompt Eval Rate: Speed at which the GPU reads and understands your input text.
- Eval Rate: Speed at which the GPU generates the response text.
RTX A4000 (Ampere) — Detailed Log
| Run | Total | Load | Prompt Tokens | Prompt Duration | Prompt Eval Rate | Gen Tokens | Gen Duration | Eval Rate |
|---|---|---|---|---|---|---|---|---|
| #1 | 6.363s | 94.97ms | 30 | 206.70ms | 145.14 t/s | 420 | 5.865s | 71.61 t/s |
| #2 | 5.437s | 85.86ms | 479 | 314.70ms | 1,522 t/s | 342 | 4.857s | 70.41 t/s |
| #3 | 4.941s | 88.65ms | 850 | 179.67ms | 4,731 t/s | 314 | 4.522s | 69.43 t/s |
| #4 | 6.154s | 85.81ms | 1,192 | 290.75ms | 4,100 t/s | 383 | 5.607s | 68.31 t/s |
| #5 | 5.348s | 83.68ms | 1,604 | 227.72ms | 7,044 t/s | 330 | 4.882s | 67.60 t/s |
RTX PRO 4000 Blackwell — Detailed Log
| Run | Total | Load | Prompt Tokens | Prompt Duration | Prompt Eval Rate | Gen Tokens | Gen Duration | Eval Rate |
|---|---|---|---|---|---|---|---|---|
| #1 | 5.516s | 121.35ms | 135 | 170.00ms | 794.27 t/s | 531 | 4.964s | 106.96 t/s |
| #2 | 10.748s | 105.36ms | 694 | 170.15ms | 4,079 t/s | 1,037 | 10.005s | 103.65 t/s |
| #3 | 5.798s | 89.80ms | 1,759 | 234.04ms | 7,516 t/s | 527 | 5.220s | 100.96 t/s |
| #4 | 8.354s | 93.76ms | 2,314 | 251.43ms | 9,203 t/s | 761 | 7.651s | 99.47 t/s |
| #5 | 10.674s | 88.86ms | 3,103 | 161.43ms | 19,222 t/s | 969 | 9.945s | 97.43 t/s |
Results: Blackwell Up to 5.47× Faster
Generation Speed (Eval Rate):
- A4000: 71.61 t/s → Blackwell: 106.96 t/s → 1.49× faster
Input Processing Speed (Prompt Eval Rate):
- A4000: 145.14 t/s → Blackwell: 794.27 t/s → 5.47× faster
Practical meaning:
- Chat AI: A 300-token response takes ~4.2s on A4000, ~2.8s on Blackwell.
- Document analysis: Reading and summarizing a 10,000-character technical doc — from tens of seconds to a few seconds.
Sustained Performance Over 5 Runs
Eval Rate degradation (thermal / context accumulation):
- A4000: 71.61 → 67.60 t/s (decline: 5.6%)
- Blackwell: 106.96 → 97.43 t/s (decline: 8.9%)
Blackwell’s decline is slightly larger, reflecting higher thermal density. But its floor (97.43 t/s) is still 44% above A4000’s ceiling (71.61 t/s) — not a practical concern.
Prompt Eval Rate acceleration (KV cache effect):
- A4000: 145 → 7,044 t/s (48.5× speedup by run 5)
- Blackwell: 794 → 19,222 t/s (24.2× speedup by run 5)
🔬 GDDR7 and the KV Cache Effect
The 19,222 t/s in run 5 comes directly from GDDR7’s memory bandwidth advantage.
LLMs store previous conversation context in a Key-Value cache in GPU memory. As conversations grow longer, the GPU must read this cache at high speed with every new token generated. Memory bandwidth becomes the bottleneck. More bandwidth = faster long-context processing.
- A4000 (GDDR6): 448 GB/s
- Blackwell (GDDR7): 672 GB/s (+50%)
In run 5 (3,103 context tokens), this bandwidth difference produces a 2.7× gap in prompt eval rate (7,044 vs 19,222 t/s). The longer the conversation, the wider Blackwell’s lead.
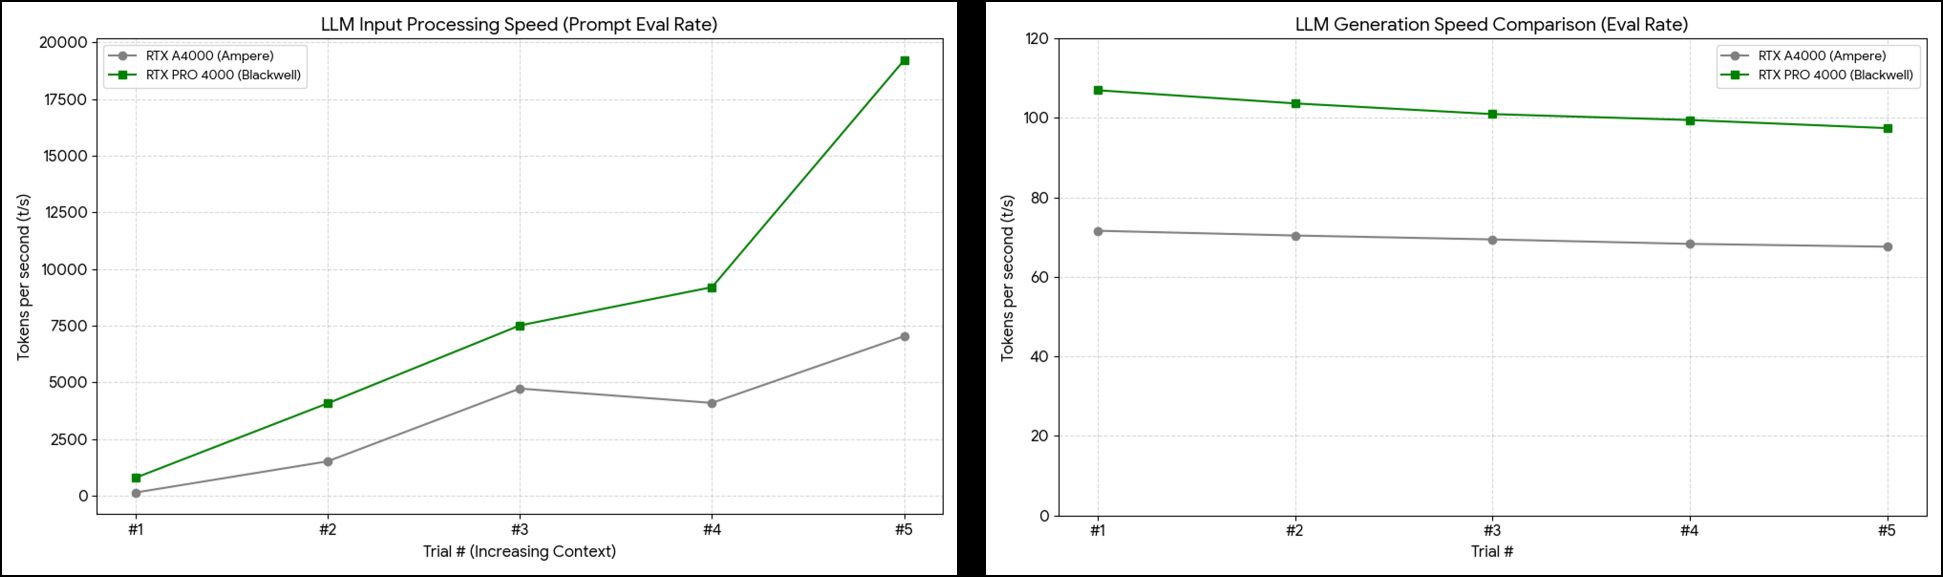
Llama 3.1 8B benchmark results
🎨 Stable Diffusion: Image Generation 1.65× Faster
Prompt: “a photograph of an astronaut riding a horse” — 200 steps (20 steps × 10 images) continuous generation.
SD 1.5 (512×512)
Settings: Steps 20, DPM++ 2M Karras, CFG 7, Seed 100000, v1-5-pruned-emaonly-fp16
| Metric | RTX A4000 | RTX PRO 4000 Blackwell | Speedup |
|---|---|---|---|
| Total generation time (10 images) | 26.3 s | 15.9 s | 1.65× |
| Model load time | 4.0 s | 0.7 s | 5.7× |
| First image speed | 13.84 it/s | 19.56 it/s | 1.41× |
| Peak speed | 13.85 it/s | 19.80 it/s | 1.43× |
| Average speed | 11.08 it/s | 14.81 it/s | 1.33× |
| VRAM usage | 26.1% (4.2 GB / 16 GB) | 18.5% (4.4 GB / 24 GB) | 1.8× headroom |
SDXL (1024×1024)
Settings: Steps 20, DPM++ 2M Karras, CFG 7, Seed 100000, sd_xl_base_1.0
| Metric | RTX A4000 | RTX PRO 4000 Blackwell | Speedup |
|---|---|---|---|
| Total generation time (10 images) | 115.3 s | 86.6 s | ~1.33× |
| First image speed | 2.53 it/s | 3.75 it/s | 1.48× |
| Peak speed | 2.61 it/s | 3.96 it/s | 1.51× |
| Average speed | 2.17 it/s | 3.10 it/s | 1.42× |
| VRAM usage | 72.5% (11.6 GB / 16 GB) | 48.8% (11.7 GB / 24 GB) | 1.8× headroom |
What the Numbers Mean
- Model load 5.7× faster: PCIe 5.0 + GDDR7 benefit. Switching models and iterating on prompts stops feeling painful.
- SDXL under 50% VRAM: The A4000 was at 72.5% — dangerously close to OOM. Blackwell’s 24 GB means you can comfortably add ControlNet, LoRA, and high-res upscaling simultaneously.
- ~1.3–1.5× throughput gains: For a creator generating 100 images/day — A4000 takes ~3.2 hours, Blackwell ~2.0 hours. 1.2 hours saved daily.
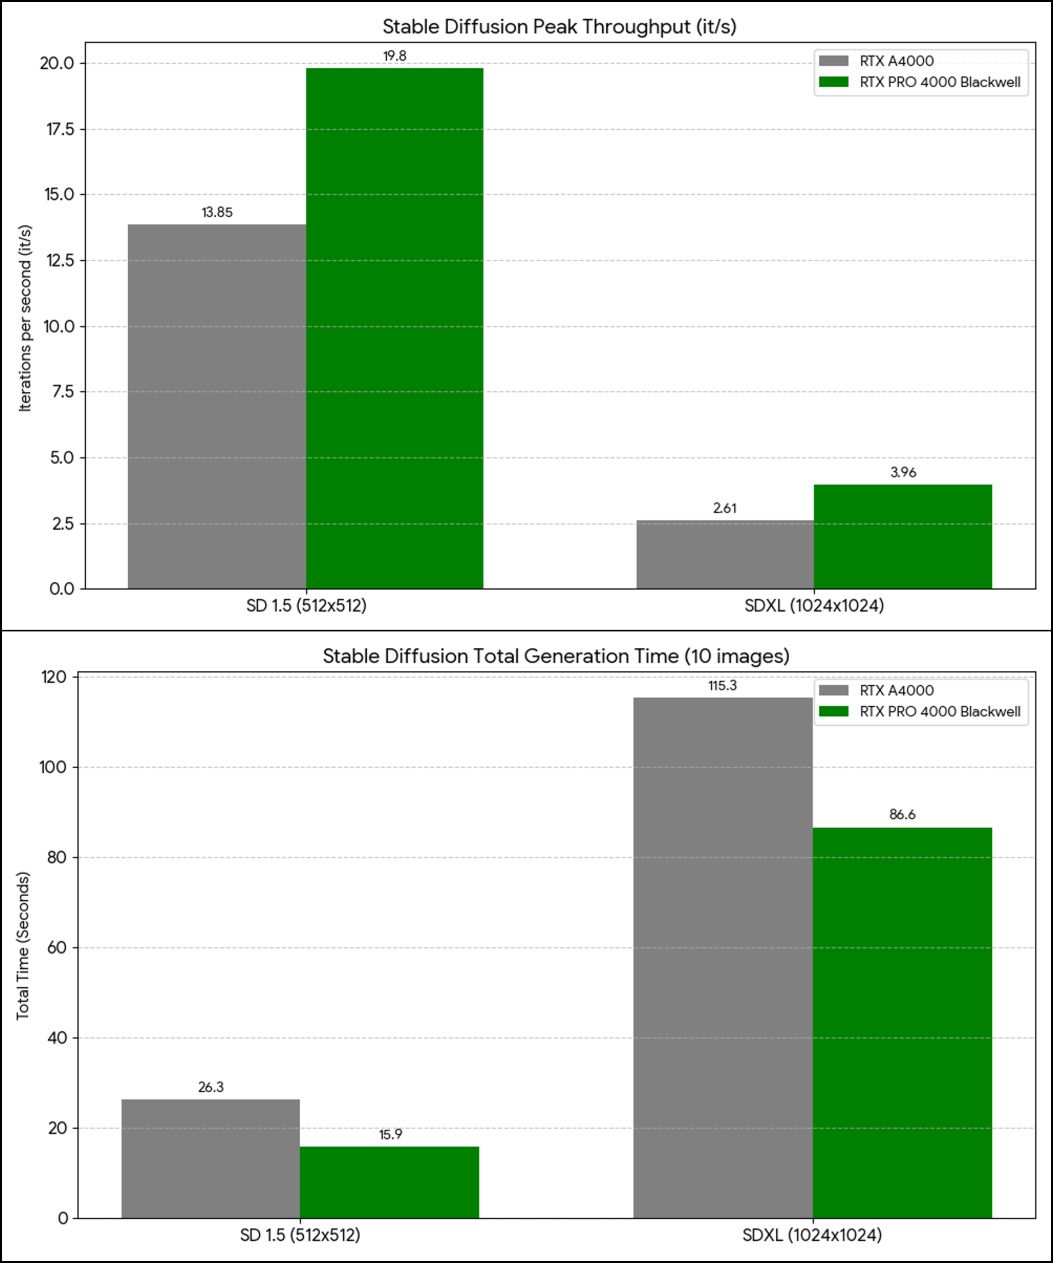
Stable Diffusion benchmark comparison
🛠 Professional / CAD: Blender 2.29× Faster
SPECviewperf 2020 v3.1
Industry-standard benchmark for professional 3D applications — CAD, medical imaging, 3D modeling.
| Workload | RTX A4000 | RTX PRO 4000 Blackwell | Improvement |
|---|---|---|---|
| creo-04 (PTC Creo) | 144.58 | 196.26 | ~1.35× |
| medical-04 (Medical imaging) | 118.99 | 194.76 | ~1.63× |
| maya-07 (Autodesk Maya) | 147.41 | 191.64 | ~1.30× |
| energy-04 (Energy simulation) | 68.04 | 140.01 | ~2.05× |
| solidworks-08 (SolidWorks) | 85.33 | 137.50 | ~1.61× |
| blender-01 (Blender) | 42.50 | 97.46 | ~2.29× |
Average across all workloads: 1.70×
Highlights:
- Blender 2.29× — Blackwell’s new architecture is extremely well-optimized here. A 30-minute render drops to ~13 minutes.
- Energy simulation 2.05× — fluid dynamics and thermal calculations under half the original time.
- SolidWorks / Medical imaging ~1.6× — large assemblies scroll and rotate noticeably more smoothly; CT volume reconstruction accelerates.
- Maya / Creo ~1.3× — consistent improvement across the board.
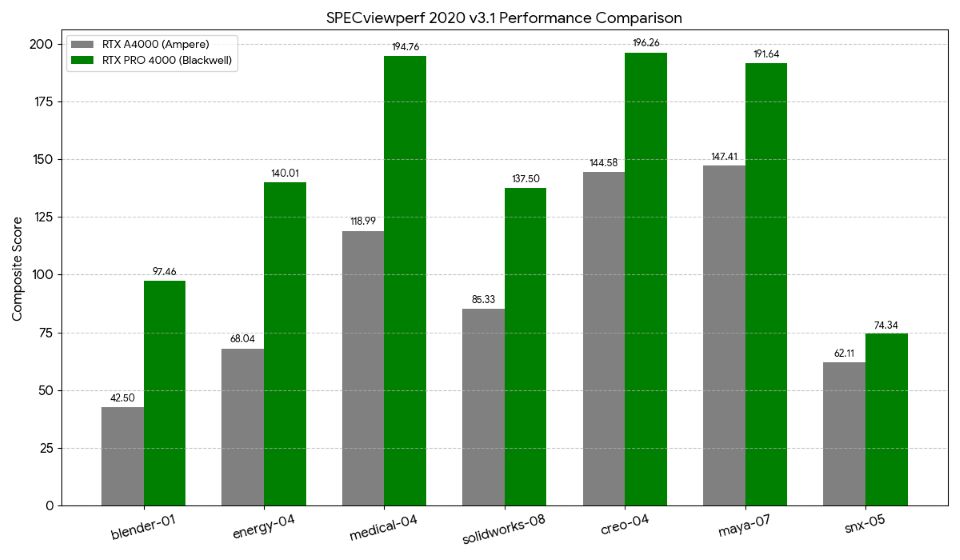
SPECviewperf 2020 v3.1 results
💻 General GPU Compute: Geekbench 6 OpenCL
Results
| Test | RTX A4000 | RTX PRO 4000 Blackwell | Improvement |
|---|---|---|---|
| Overall Score | 124,021 | 201,859 | 1.63× |
| Background Blur | 45,688 (189.1 img/s) | 58,051 (240.3 img/s) | 1.27× |
| Face Detection | 34,123 (111.4 img/s) | 49,719 (162.3 img/s) | 1.46× |
| Horizon Detection | 176,097 (5.48 Gpx/s) | 277,936 (8.65 Gpx/s) | 1.58× |
| Edge Detection | 213,754 (7.93 Gpx/s) | 312,599 (11.6 Gpx/s) | 1.46× |
| Gaussian Blur | 152,197 (6.63 Gpx/s) | 302,609 (13.2 Gpx/s) | 1.99× |
| Feature Matching | 30,324 (1.20 Gpx/s) | 45,371 (1.79 Gpx/s) | 1.49× |
| Stereo Matching | 552,836 (525.5 Gpx/s) | 1,142,300 (1.09 Tpx/s) | 2.07× |
| Particle Physics | 373,809 (16,452 FPS) | 700,933 (30,849 FPS) | 1.87× |
The pattern is clear: memory-bandwidth-intensive tasks (Stereo Matching, Gaussian Blur) see the largest gains — direct evidence of GDDR7’s 672 GB/s in action. Tasks already well-optimized for Ampere (Background Blur) see smaller gains.
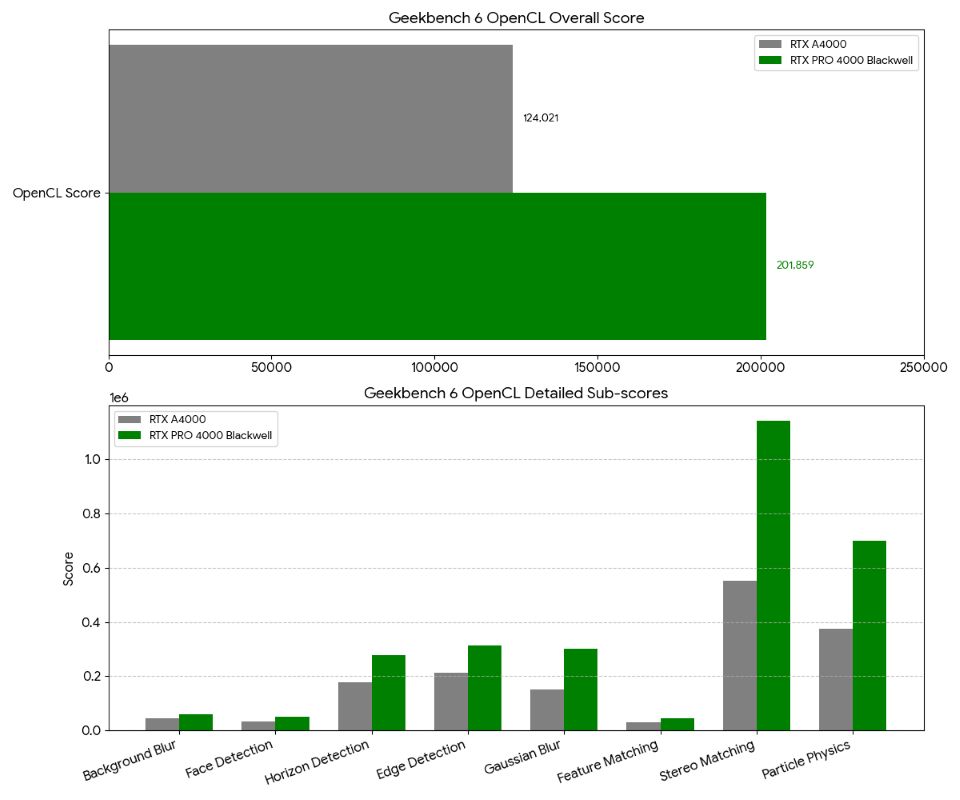
Geekbench 6 OpenCL benchmark results
🎮 Gaming: Final Fantasy XIV Endwalker Benchmark
Workstation GPUs aren’t designed for gaming — but let’s see how it stacks up. Settings: 1920×1080, High Quality (Desktop PC), DirectX 11, AMD FSR enabled.
Results
| Metric | RTX A4000 | RTX PRO 4000 Blackwell | Delta |
|---|---|---|---|
| Benchmark Score | 17,775 | 21,843 | 1.23× |
| Average FPS | 131.38 fps | 166.54 fps | 1.27× |
| Minimum FPS | 58 fps | 59 fps | ~Equal |
| Loading Time Total | 9.741 s | 10.068 s | ~Equal (noise) |
| Rating | Very Comfortable | Very Comfortable | — |
The Blackwell hits 166 fps average — enough to fully utilize a 144Hz or 165Hz monitor in 1080p High settings. Both GPUs rated “Very Comfortable.” Loading times differ by 0.3 seconds, which is noise.
This isn’t the intended use case for a workstation GPU — but if you want to unwind with games after work hours, the RTX PRO 4000 handles it without compromise.
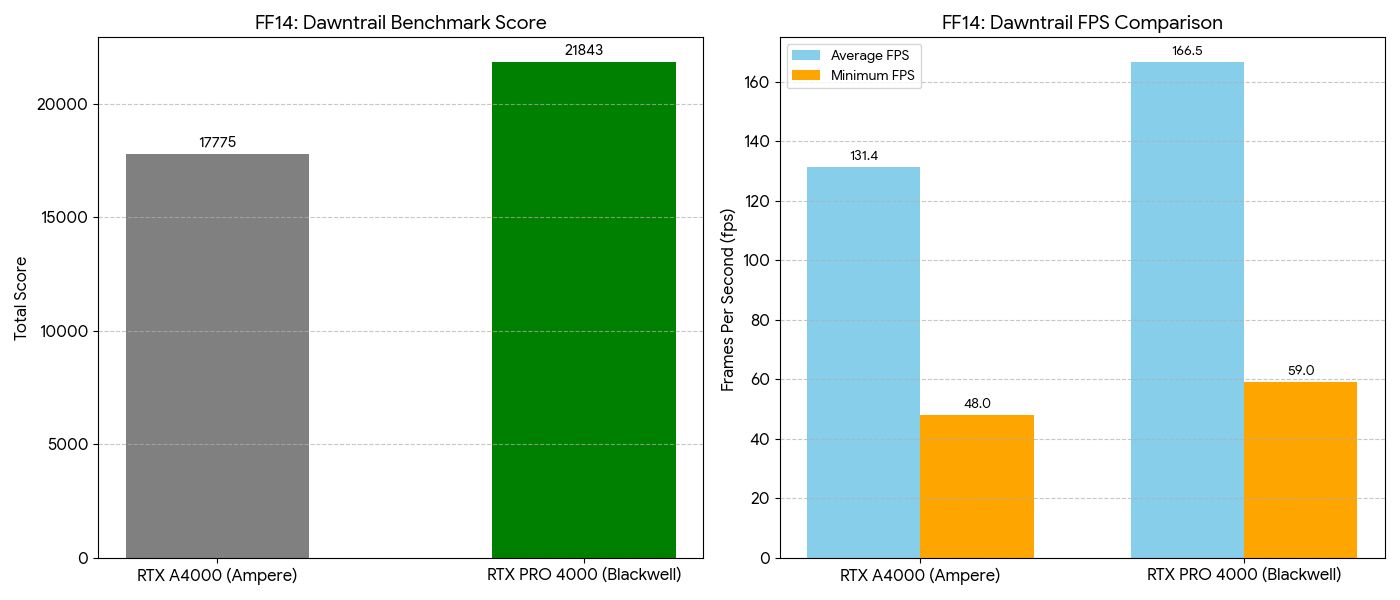
FF14 Endwalker benchmark (1080p High)
🆚 RTX PRO 4000 Blackwell vs RTX 4090: Which Should You Buy?
Spec Comparison
| Spec | RTX PRO 4000 Blackwell | GeForce RTX 4090 |
|---|---|---|
| Architecture | GB203 (Blackwell / 5nm) | AD102 (Ada / 4nm) |
| CUDA Cores | 8,960 | 16,384 |
| VRAM | 24 GB GDDR7 | 24 GB GDDR6X |
| TDP | 145 W (std) / 70 W (SFF) | 450 W |
| Slot Width | 1-slot | 3+ slots |
| ECC Memory | Yes | No |
| NVLink | Yes | No (removed in Ada gen) |
| Estimated Price | ~$2,400–2,700 | ~$2,000–2,200 |
The Verdict by Use Case
- AI / LLM is your primary workload — ECC, NVLink, GDDR7 bandwidth all matter
- You want multi-GPU — 1-slot design enables 2–3 cards for 48–72 GB VRAM builds
- You run 24/7 — 145 W vs 450 W means significant annual electricity savings
- You need workstation certification — ISV support for SolidWorks, Creo, Maya
- You have a compact / SFF system — SFF model needs no aux power cable
- Gaming is your primary use — DLSS 3 Frame Generation, Game Ready Drivers, raw gaming optimizations
- You need maximum single-GPU throughput — 16,384 CUDA cores wins in pure compute-bound workloads
- Budget is constrained — RTX 4090 is generally cheaper on the used/gray market
💰 Cost Analysis
Purchase Cost + Annual Running Cost
| RTX PRO 4000 Blackwell (Std) | RTX A4000 | RTX 4090 | |
|---|---|---|---|
| Estimated Price | ~$2,500–2,800 | ~$1,000–1,500 new | ~$2,000–2,200 |
| TDP | 145 W | 140 W | 450 W |
| Annual electricity (24/7 @ $0.12/kWh) | ~$152/yr | ~$147/yr | ~$474/yr |
The RTX 4090’s $322/year electricity premium over the Blackwell pays back the price difference in about 2–3 years at 24/7 operation. The SFF model (~70 W) cuts the Blackwell’s annual electricity cost to ~$74/yr.
🌡️ Thermal Performance: 1-Slot Stability Under Load
Packing 8,960 CUDA cores (45.8% more than A4000) into a single-slot card raises obvious thermal questions. Across all tests in this article:
- 5 consecutive Llama 3.1 8B inference runs
- 200-step Stable Diffusion generation (SD 1.5 + SDXL)
- Multiple FF14 benchmark passes
No thermal throttling, no crashes, no unexplained slowdowns — sustained A4000-beating performance throughout. The 1-slot constraint is a physical reality but not a thermal liability in practice.
✅ Summary
| Workload | Speedup | Highlight |
|---|---|---|
| AI inference — generation (Eval Rate) | 1.49× | Strong from the first token |
| AI inference — input processing (Prompt Eval Rate) | 5.47× | GDDR7 KV-cache effect; dominates in RAG / long context |
| SD 1.5 generation | 1.33–1.65× | Model load 5.7× faster |
| SDXL generation | 1.42× | VRAM headroom 1.8× — no more OOM risk |
| General GPU compute (Geekbench 6) | ~1.63× | Stereo Matching 2.07×, Gaussian Blur 1.99× |
| CAD / Pro apps (SPECviewperf avg) | ~1.70× | Blender 2.29× |
| Gaming (FF14 avg FPS) | 1.27× | 166 fps — 144Hz monitors fully utilized |
Who Should Upgrade
RTX PRO 4000 Blackwell (Standard) is for you if:
- AI and LLM inference is part of your daily workflow
- You run Stable Diffusion / SDXL regularly
- You’re running out of VRAM headroom for CAD work
- You want multi-GPU expandability from a compact footprint
- You want workstation + gaming in one card
RTX PRO 4000 Blackwell (SFF) is for you if:
- You need high-end GPU performance in a small-form-factor PC
- You’re building a 24/7 AI inference server and electricity costs matter
- You want to avoid aux power cable routing entirely
RTX A4000 remains practical for:
- Inference with small-to-medium models
- SD 1.5 at standard resolutions
- Standard CAD work without VRAM pressure
- Anyone where VRAM 16 GB is sufficient and budget matters
❓ FAQ
Q1. Can the RTX PRO 4000 Blackwell handle gaming?
Yes. FF14 benchmark logged 166 fps average (1080p High) — comfortably above 144Hz. It’s not a gaming GPU in the marketing sense, but gaming alongside workstation tasks is fully viable.
Q2. Standard (145 W) or SFF (~70 W)?
Standard if you want the benchmarked performance. SFF if you’re in a compact system or running 24/7 and power draw matters. SFF will perform lower due to half the TDP — exact numbers aren’t benchmarked here.
Q3. Is upgrading from RTX A4000 worth it?
Worth it if you hit VRAM limits on SDXL or large models, want faster long-context LLM inference (5.47× gains matter here), or your work involves significant Blender/CAD time. Not worth it for light inference or SD 1.5 at standard settings where A4000 is already comfortable.
Q4. What does 24 GB VRAM unlock?
SDXL at 1024×1024+ with full extension stacks (ControlNet, LoRA, upscaler simultaneously). Llama 70B inference with a second card in NVLink. Large CAD assemblies without paging. Running multiple parallel AI workloads without OOM.
Q5. RTX PRO 4000 Blackwell vs RTX 5000 (GeForce Blackwell)?
The PRO line is workstation-class: ECC memory, NVLink, ISV certification, Studio driver stability. GeForce RTX 5000 is consumer-class: better for gaming, no ECC, no NVLink, larger physical footprint. Use case determines the right answer.
Q6. Which is better for AI: RTX PRO 4000 Blackwell or RTX 4090?
RTX PRO 4000 Blackwell wins on ECC (prevents silent computation errors in long training runs), NVLink (multi-GPU VRAM pooling for 70B+ models), GDDR7 bandwidth (faster KV-cache in long contexts), and power efficiency (145 W vs 450 W for 24/7). RTX 4090 wins on raw CUDA core count (16,384 vs 8,960) for single-GPU peak throughput.